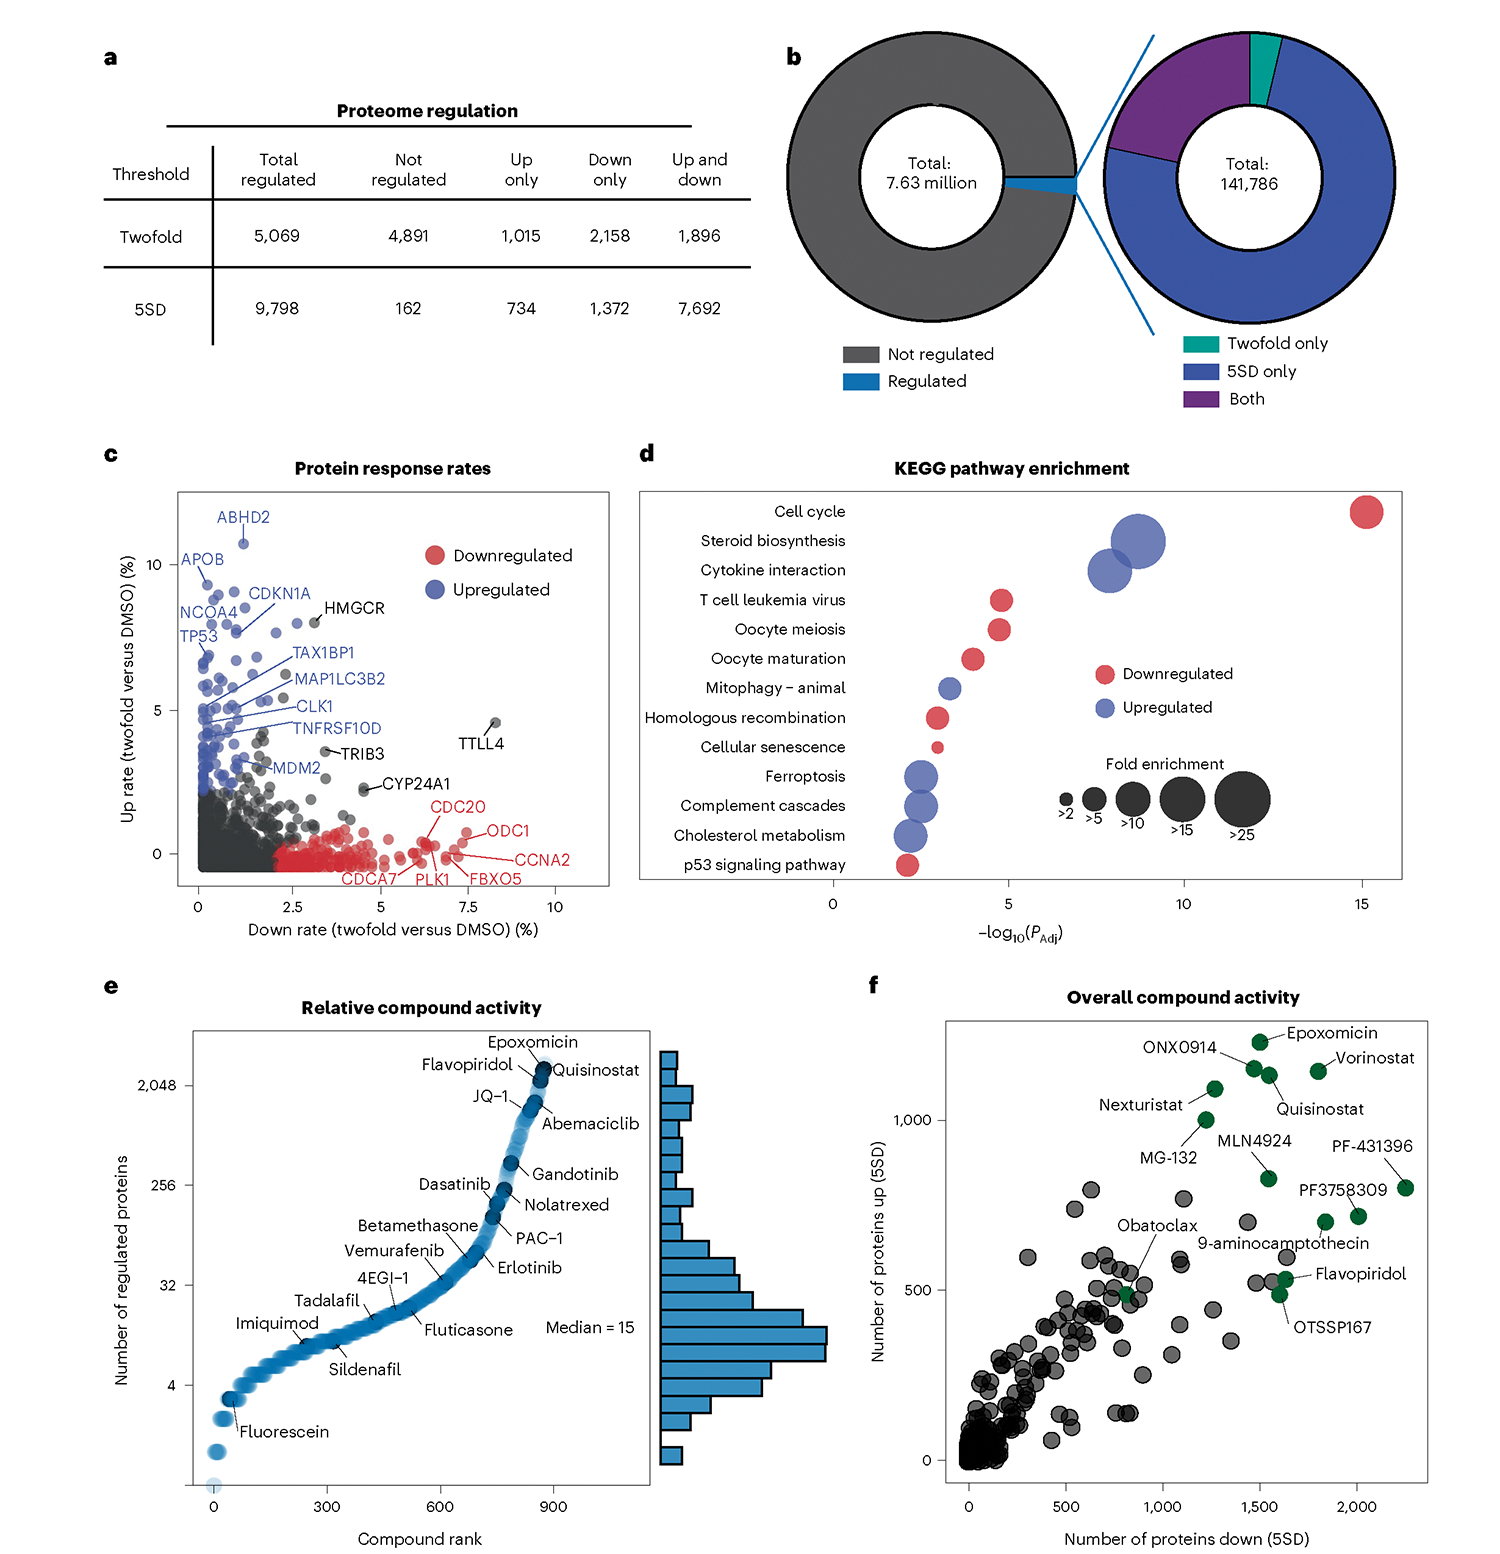
Fig. 2 |. Most of the proteome is accessible to regulation by small molecules.

a, Statistics for protein-level regulation using two significance thresholds: 5SD and twofold change (compound versus DMSO). Regulated proteins were perturbed by one or more compounds in the dataset. b, Breakdown of all regulated events by a 5SD change, a twofold change or both. Around 1.9% of all 7.6 million protein measurements were regulated events. c, Rate at which proteins increased by twofold (n = 97) versus decreased (n = 213) by twofold. Only proteins quantified in at least half of compounds are shown (n = 8,860). Change rate is calculated by taking the number of compounds affecting expression by twofold and dividing by the number of compounds where the protein was quantified. d, KEGG pathway enrichment analysis from c. e, Compound-level waterfall plot highlighting the number of regulated proteins (by 5SD and/or twofold change) for each compound. f, Activity of each compound measured by the number of proteins decreased (x axis) and increased (y axis) by 5SD 24 h after treatment.
