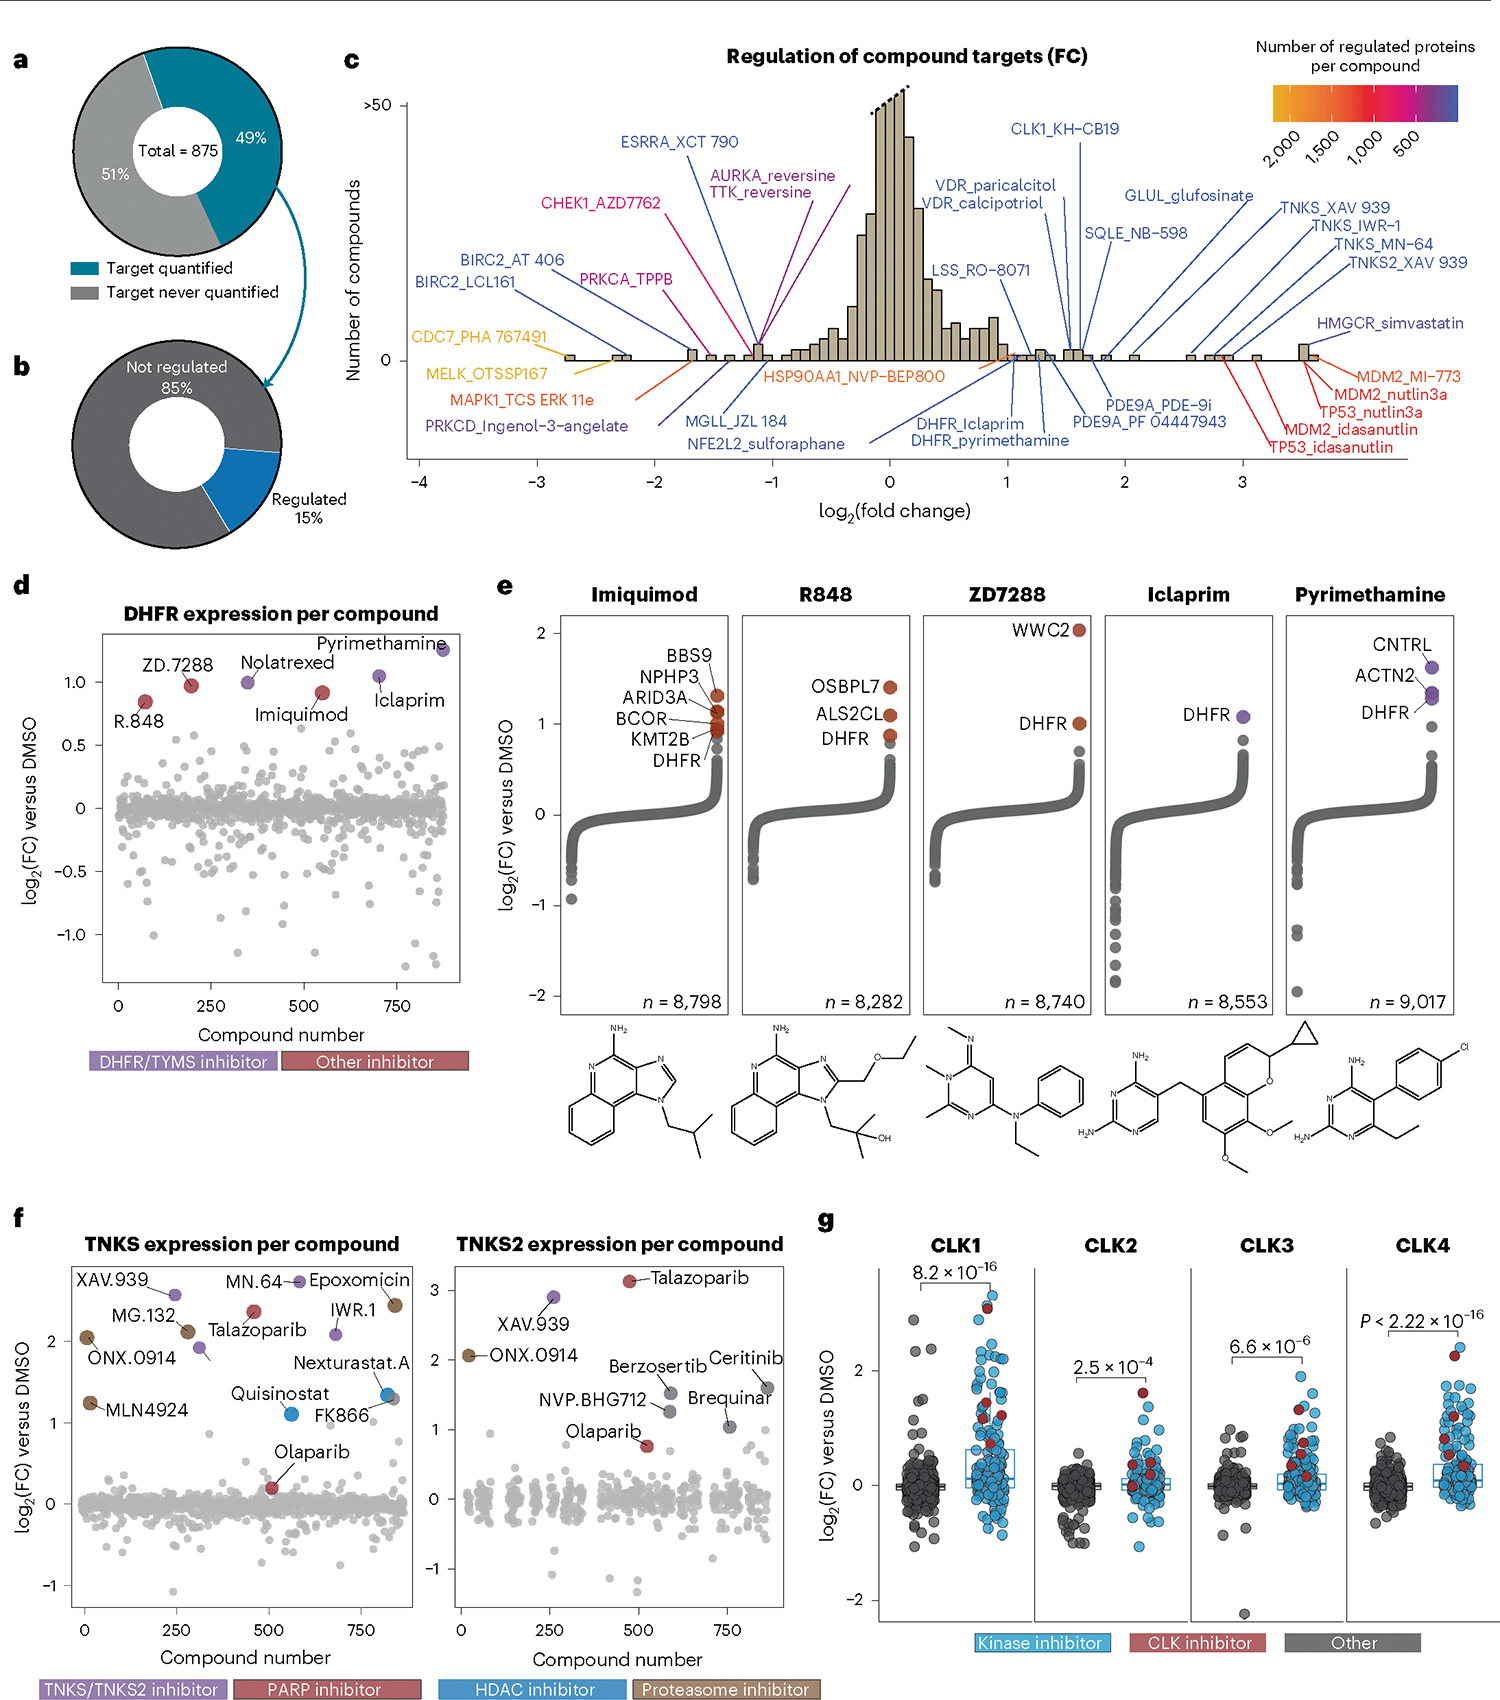
Fig. 3 |. Regulation of target proteins by small molecules informs compound MOA.

a, Proportion of primary targets identified in this dataset. b, Proportion of primary and first secondary, if applicable, targets regulated by 5SD or twofold, n = 541. c, Histogram of compounds that regulate their target protein (primary and one secondary target) by twofold versus DMSO. Annotations are ‘TargetGene_CmpdName,’. d, Expression of DHFR for all 875 compounds. Those that increase DHFR expression are highlighted. e, Protein expression of all quantified proteins for compounds highlighted in d. f, Expression of TNKS/TNKS2 for all compounds, colored by inhibitor class. g, CLK1, CLK2, CLK3 and CLK4 expression across the dataset. Reported P values were generated from unpaired, two-sided Wilcoxon test. For CLK1, n = 875; CLK2, n = 857; CLK3, n = 875; CLK4, n = 808. The center line represents the median, the upper and lower bounds of the box indicate the interquartile range (IQR, the range between the 25th and 75th percentiles) and whiskers extend to the highest and lowest values within 1.5 times the IQR.
