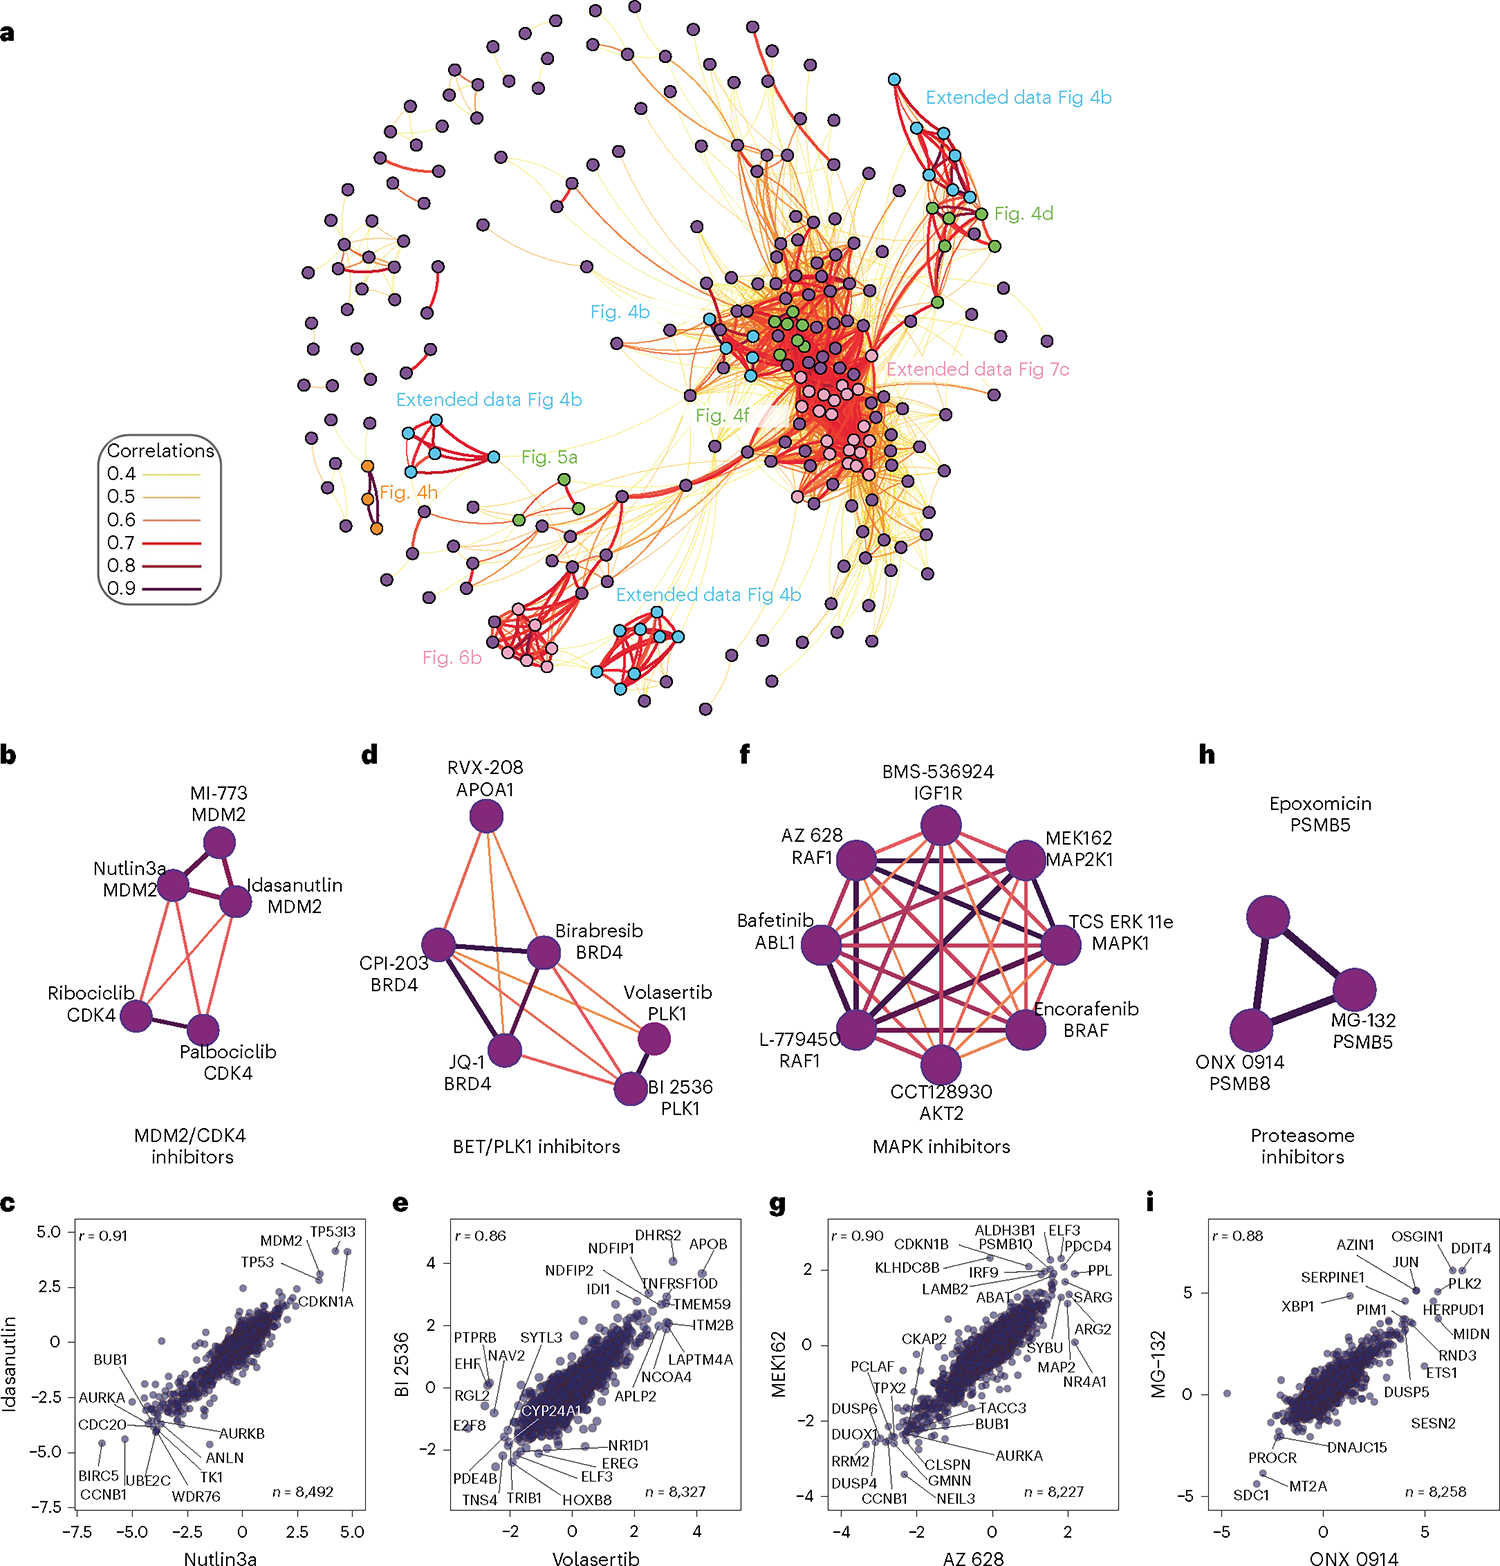
Fig. 4 |. Mechanism of action drives compound community organization.

a, Community plot built from a compound–compound correlation matrix. b, Subcommunity of MDM2 and CDK4/6 inhibitors. All subcommunities are filtered to only include edges with r > 0.6. c, Pairwise correlation plot of the MDM2 inhibitors Idasanutlin and Nutlin3a. d, Subcommunity of BRD4 and PLK1 inhibitors. e, Pairwise correlation plot of the PLK1 inhibitors BI-2536 and volasertib. f, Subcommunity of compounds correlated to the RAF inhibitor L-779450 containing many inhibitors of the MAP kinase family. g, Pairwise correlation plot of the MAP kinase pathway inhibitors MEK126 and AZ628. h, Subcommunity of proteasome inhibitors. i, Pairwise correlation plot of MG132 and ONX0914—two strongly correlated proteasome inhibitors. For all pairwise correlation plots (c, d, g, i), all x and y axes are represented as log2(FC) (compound versus DMSO) with Pearson (r) reported.
