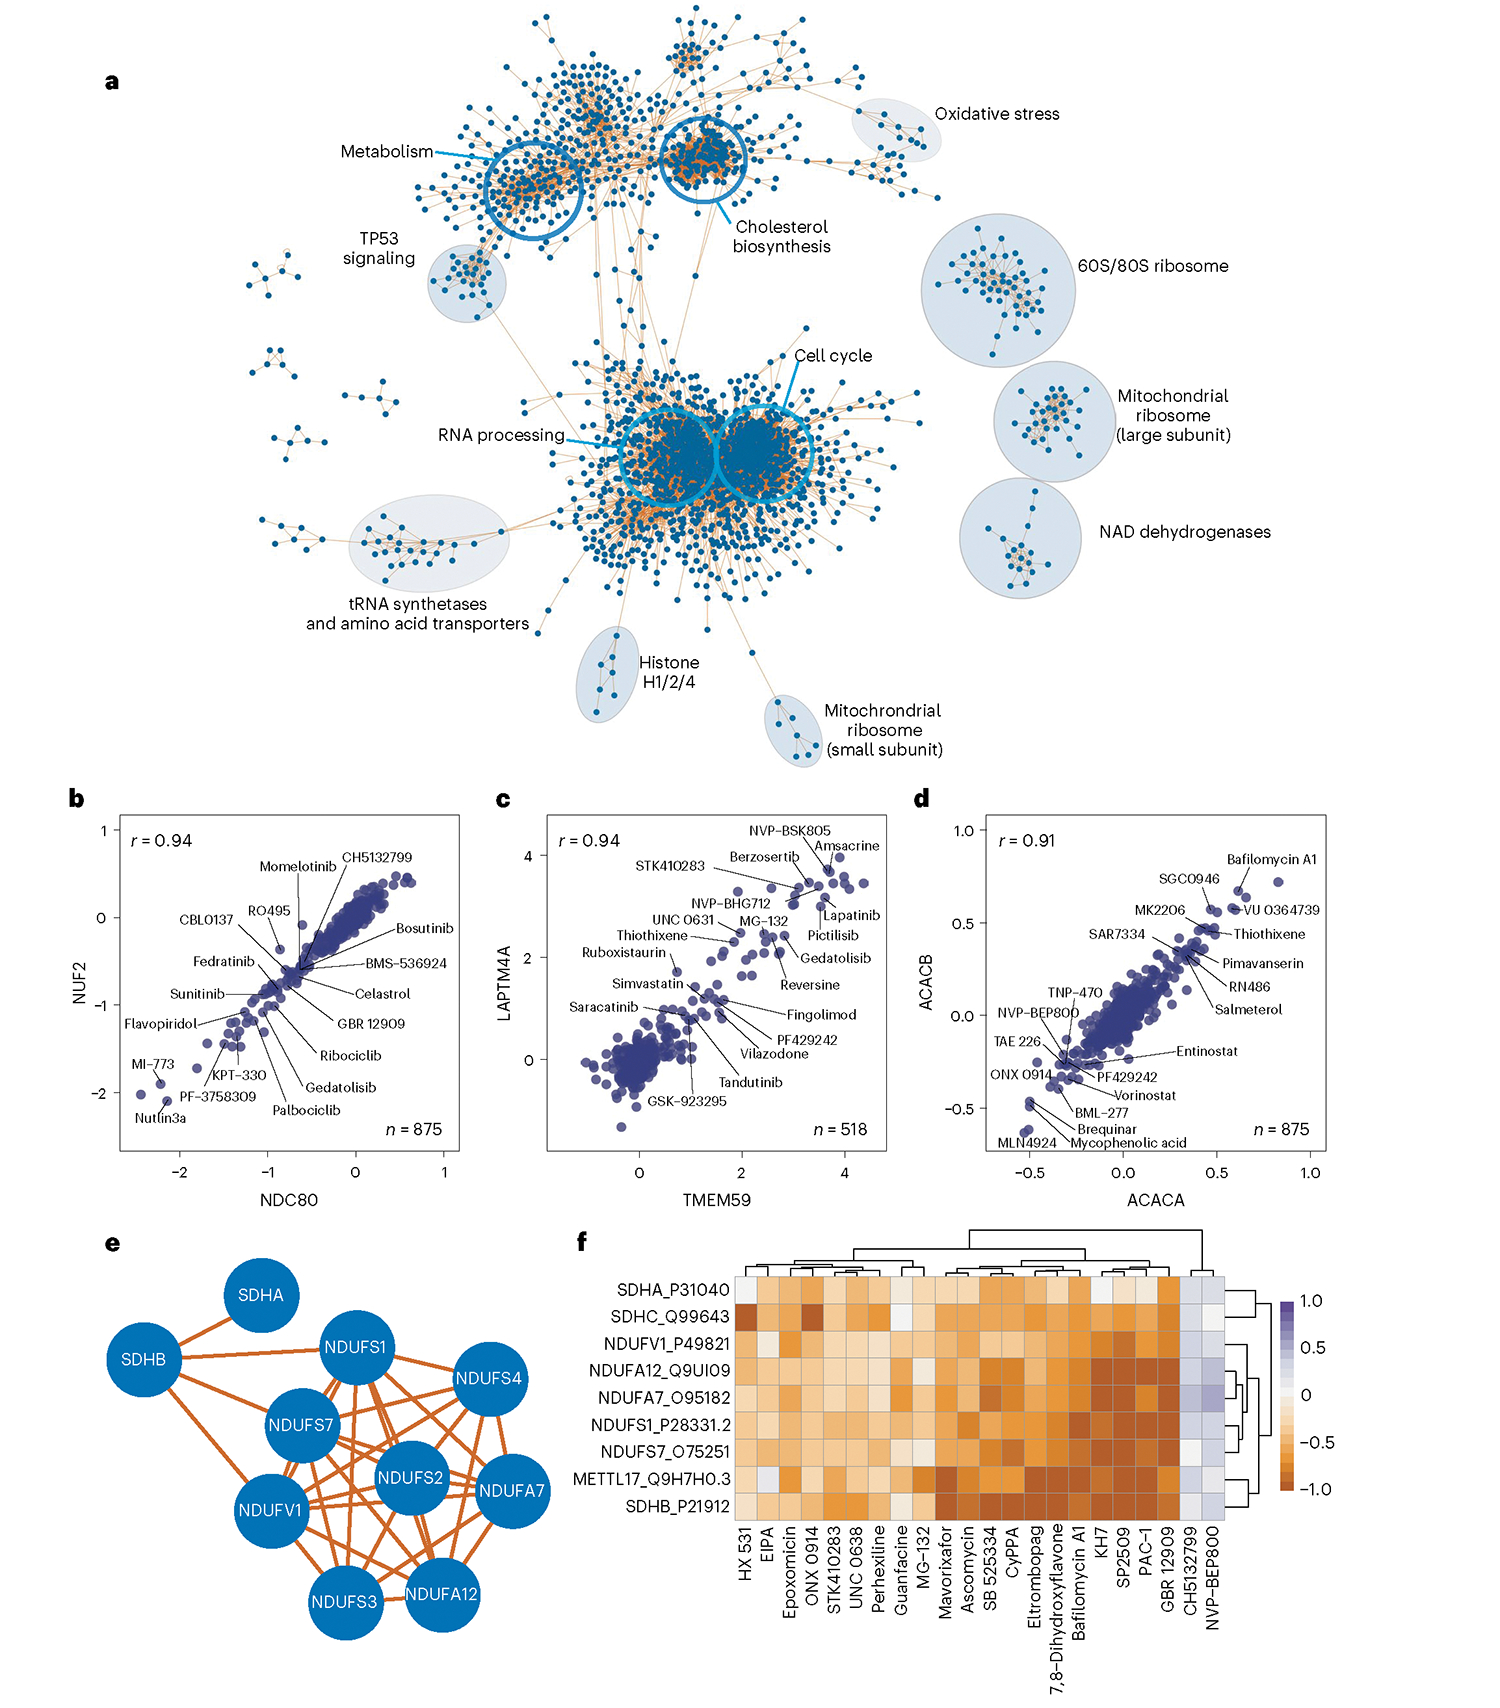
Fig. 5 |. Protein–protein correlations highlight relationships between drug response pathways.

a, Community network of protein–protein correlations. Only positive correlations and communities larger than five members are included in this network. Open blue circles denote enriched GO molecular function GO categories for the proteins within the circle. Filled circles are annotated manually based on the composition of the proteins within the circle. b–d, Pairwise correlation plot of: b, kinetochore proteins NUF2 and NDC80, c, lysosomal protein LAPTM4A and autophagy regulator TMEM59, d, acetyl CoA carboxylase 1 (ACACA) and 2 (ACACB), with select compounds highlighted that affect the expression of each pair of proteins. All x and y axes are represented as log2(FC) (compound versus DMSO). Each point represents one compound. e, Subcommunity of correlated proteins, including several NAD and succinate dehydrogenases. f, Heatmap of protein expression for each protein in e for all compounds that increase or decrease their expression by a median log2(FC) of greater than 0.5 or less than −0.5.
