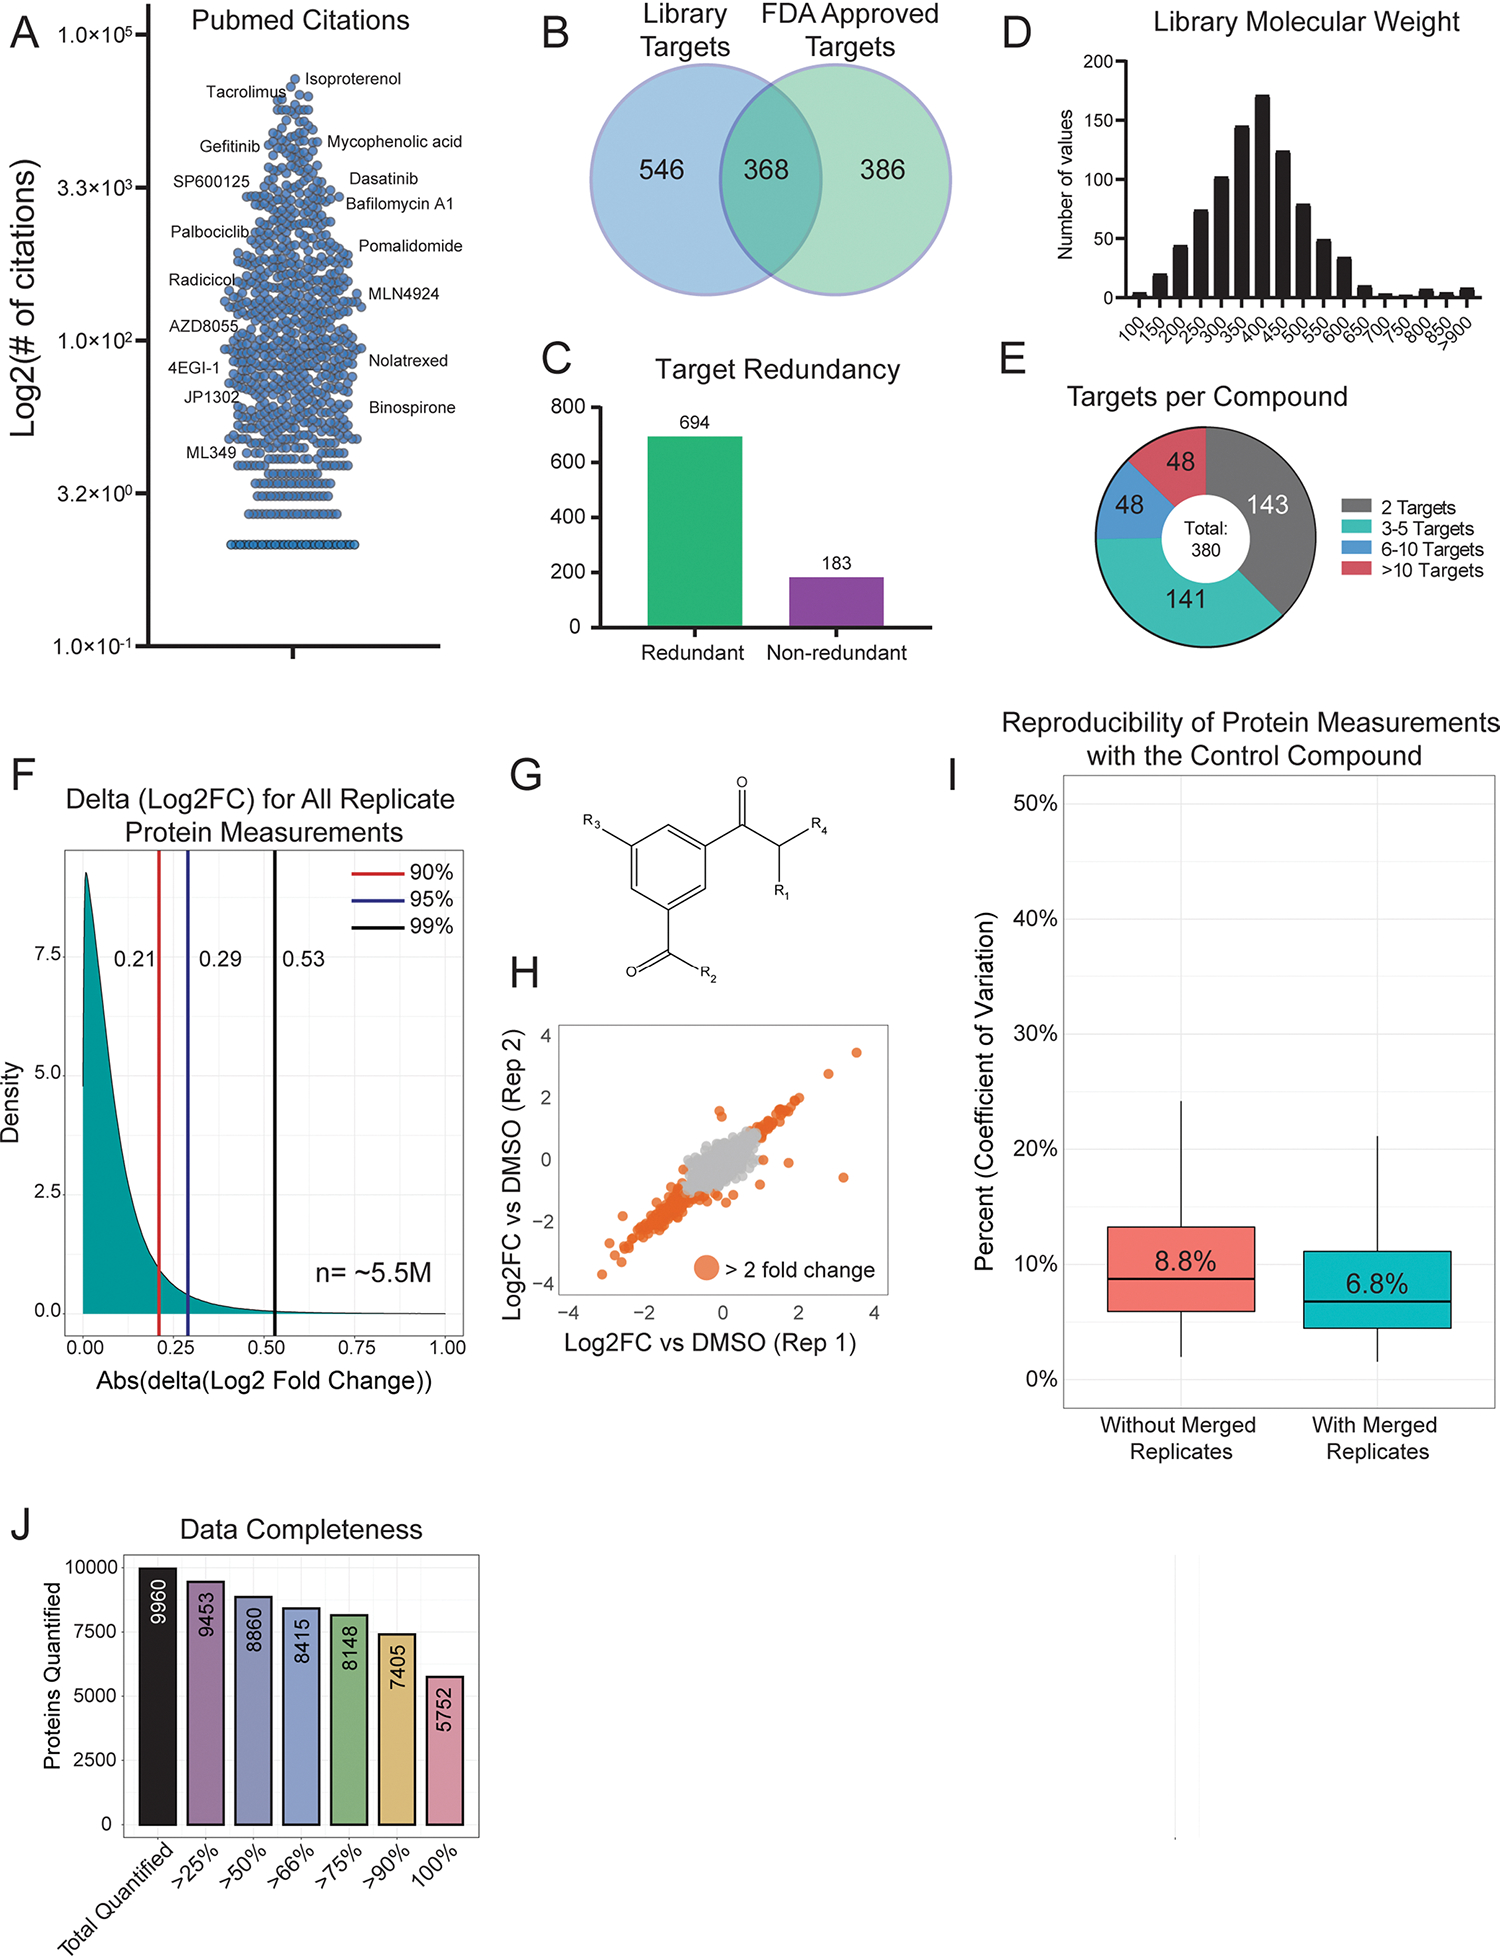
Extended Data Fig. 1 |. Details on the MOA library and measurement reproducibility.

(a) Number of PubMed citations per library compound, with select examples shown. (b) Overlap of all annotated targets from the MOA library and all targets with an FDA approved drug. The list of FDA approved drug targets was acquired from The Human Protein Atlas (proteinatlas.org) (c) Target redundancy for compounds in the library. 694 compounds are annotated to target a protein that is also targeted by another compound. 183 compounds target proteins that are unique among the library. All annotated targets were considered. (d) Distribution of compound molecular weight across the MOA library. (e) A breakdown of the number of annotated targets per compound. 495 compounds have one annotated target. (f) Distribution of the absolute difference between replicate protein measurements. The difference between Log2 fold change (compound versus DMSO) measurements was compared for the same protein treated with the same compound. The ~5.5 million Log2FC differences between biological replicate 1 and biological replicate 2 represents ~11 million total protein measurements. (g) Basic structure of the control compound included 55 times across all 170 TMT groups. (h) Representative plot comparing the Log2 FC values for two replicates of the control compound. The median Pearson correlation (r) for two replicates of the control compound was 0.87, which is the correlation of the two replicates shown. (i) Percent coefficient of variation (CV) protein level fold-change measurements across all 55 biological replicates (red). After merging/averaging two biological replicates (coming from the same 96-well plate position, as is the case for other compound replicates), the Percent CV was recalculated (blue). The center line represents the median, the upper and lower bounds of the box indicate the interquartile range (IQR, the range between the 25th and 75th percentiles), and whiskers extend to the highest and lowest values within 1.5 times the IQR. (j) Bar graph showing dataset completeness. For example, 8,860 proteins were quantified in at least half (438) of the compound treatments.
