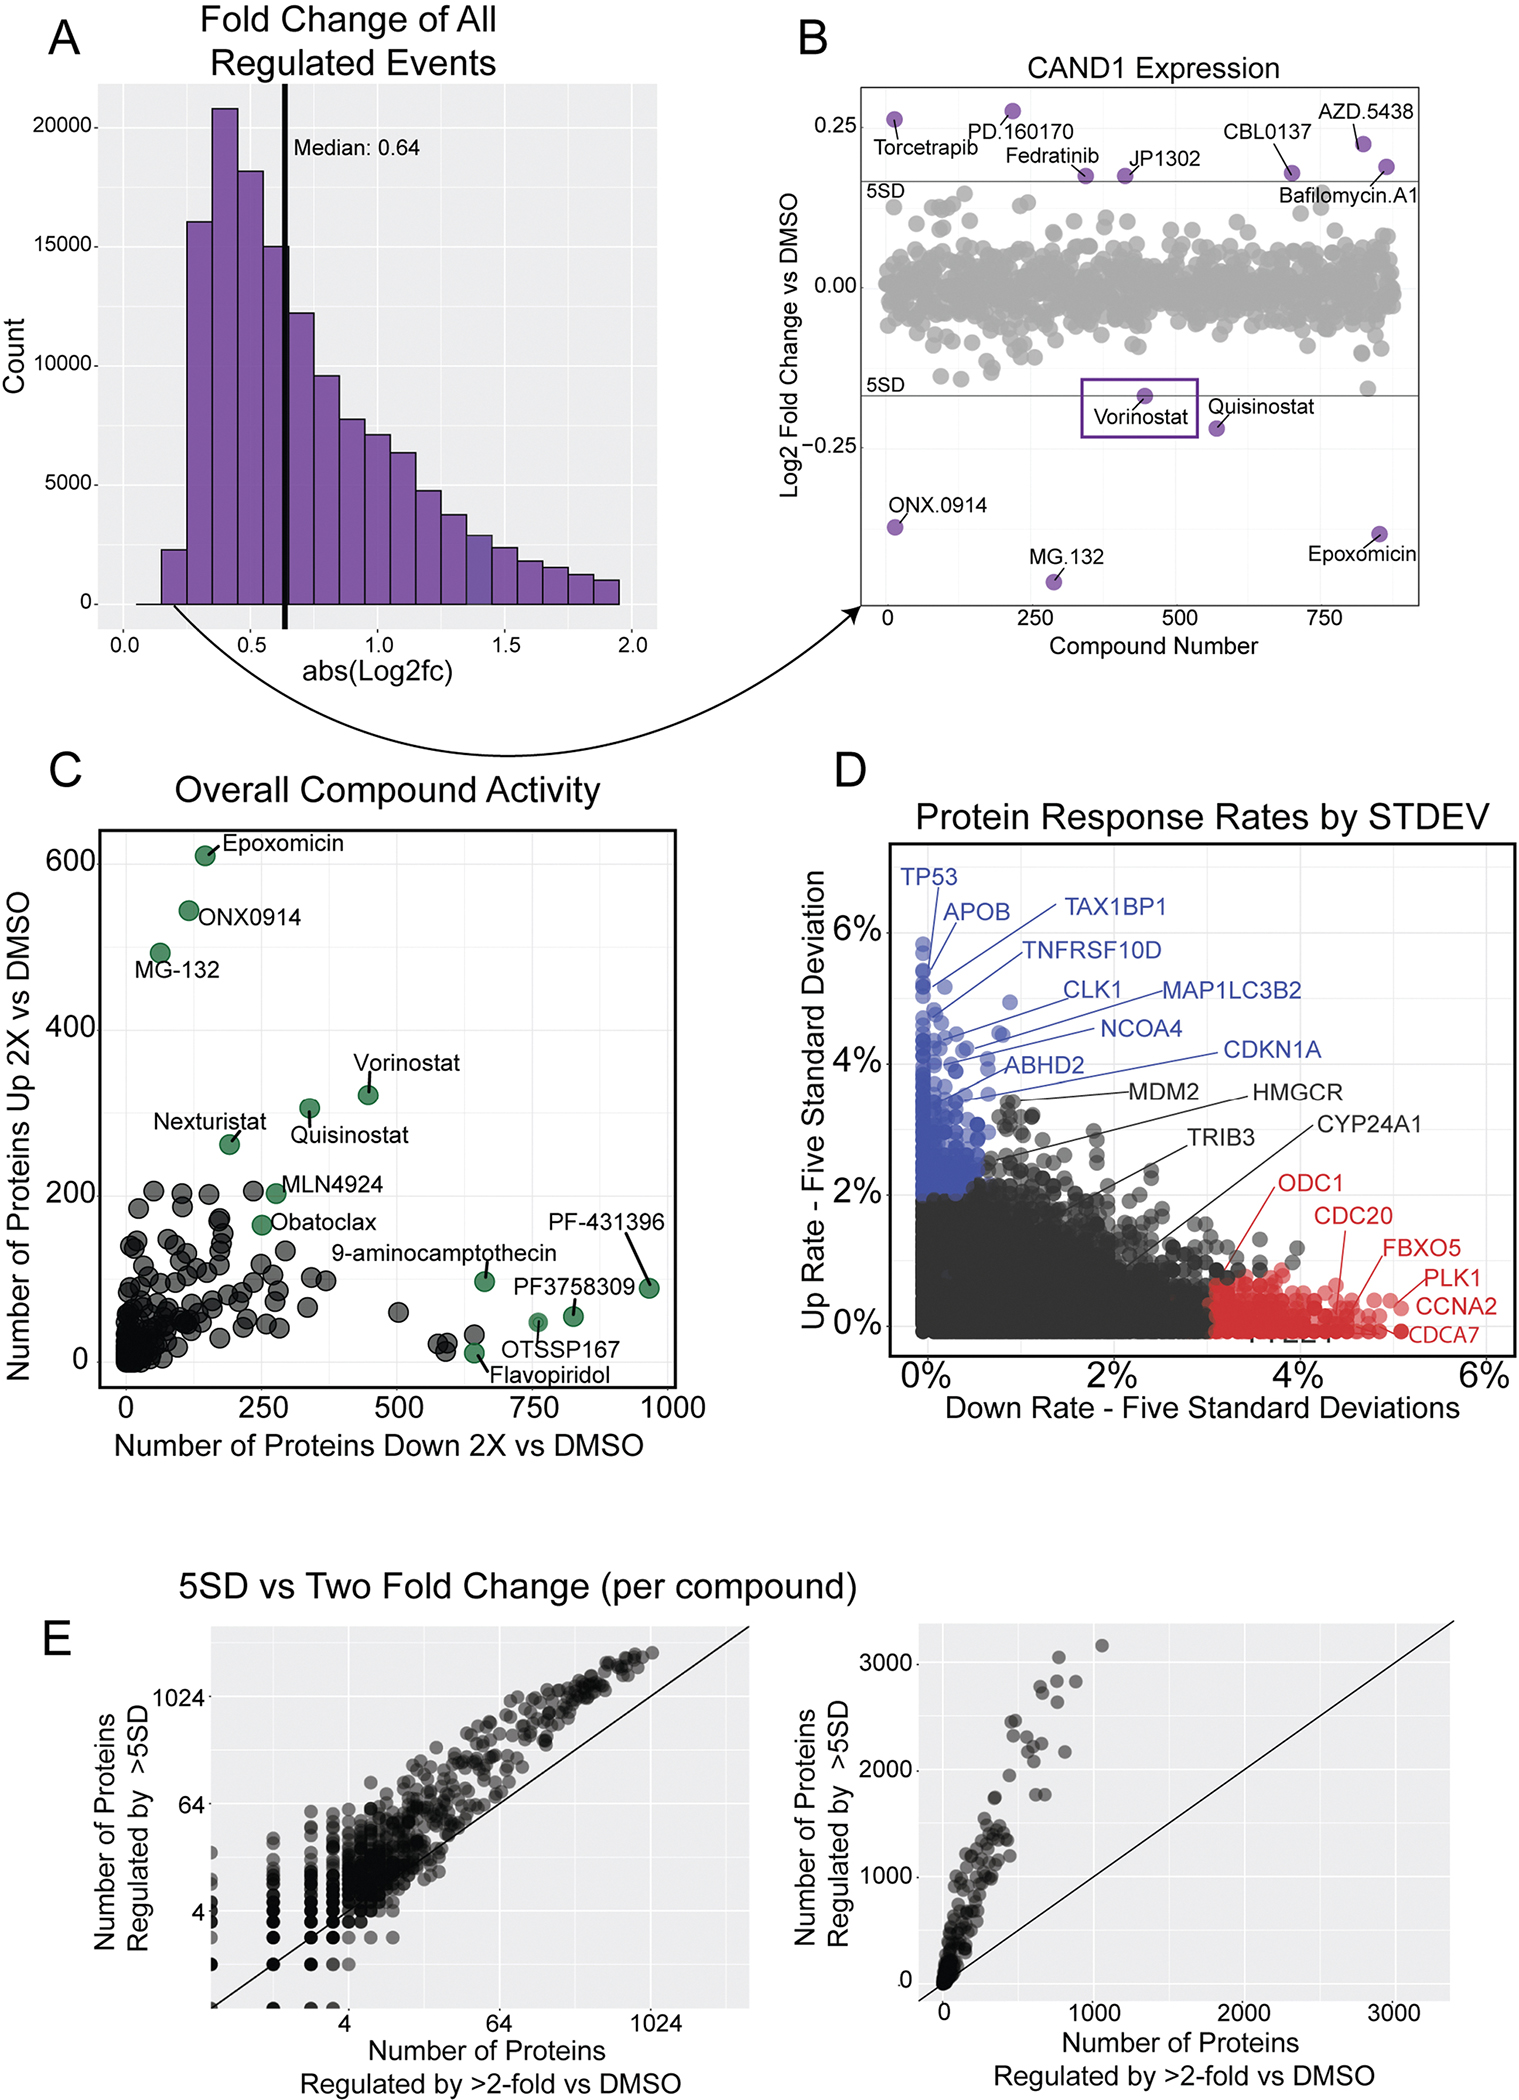
Extended Data Fig. 2 |. Illustration of five standard deviations as a suitable threshold for regulated events.

(a) Histogram of absolute value Log2 fold change for all regulated events (5 standard deviations or two fold change–n = 141,786). The histogram is truncated at abs(L2FC) = 2 for clarity. (b) Scatterplot of CAND1 expression, highlighting the regulation event with the lowest fold change in the dataset (n = 875 compounds). Vorinostat and Quisinostat (both HDAC inhibitors) regulated CAND1 to similar levels. The three proteasome inhibitors in the dataset, ONX0914, MG132, and Epoxomicin, all downregulate CAND1. (c) The activity of each compound measured by the number of proteins decreased (x-axis) and increased (y-axis) by two-fold versus DMSO. Compare to Fig. 2f, which is the same graph using a five standard deviation cutoff. (d) Rate at which proteins increase versus decrease by five standard deviations. Proteins that mostly increase with small molecule treatments are in blue, those that mostly decrease in red. Only those proteins quantified in more than half of compound are shown (n = 8,860). Change rate is calculated by taking the number of compounds affecting expression by five standard deviations and dividing by the compounds where the protein was quantified. Compare to Fig. 2c, which is the same graph using two-fold versus DMSO cutoff. (e) Illustration of the two different regulation cutoff thresholds for each compound in the dataset. The number of proteins regulated by 5 standard deviations (y-axis) versus the number of proteins changed by two-fold versus DMSO (x-axis). Log scale (left) and linear (right). The line represents y = x. The slope of the scatterplot = ~3.
