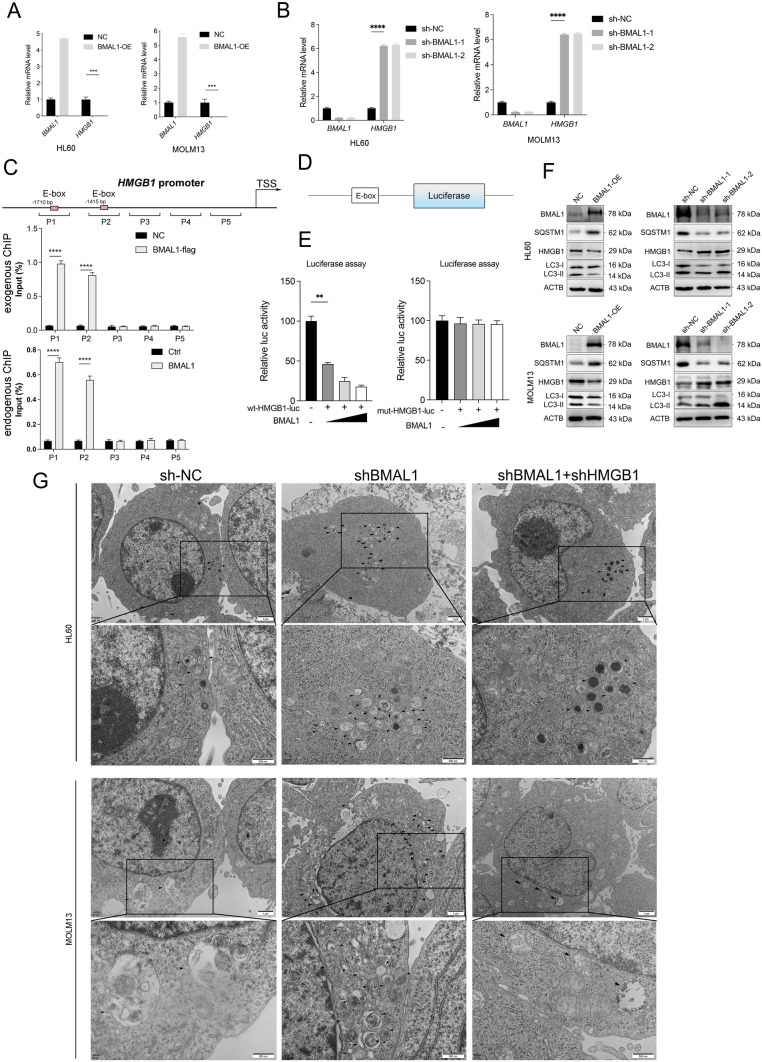
Fig. 3.
BMAL1 regulates ferroptosis via HMGB1-autophagy-GPX4 pathway. A Quantitative polymerase chain reaction (qPCR) analysis of the HMGB1 mRNAs in both controls and BMAL1-overexpressing HL60 and MOLM13 cells following treatment with RSL3 (1.0 μM) for 24h. B Quantitative polymerase chain reaction (qPCR) analysis of the HMGB1 mRNAs in both controls and BMAL1-depleted HL60 and MOLM13 cells following treatment with RSL3 (1.0 μM) for 24h. C ChIP-qPCR analysis was used to determine the binding affinity of BMAL1 to HMGB1 promoter regions.293T cells were transfected with BMAL1 overexpression plasmid that ChIP-qPCR with Flag(left) were performed as the control(left). 293T cells were not transfected with BMAL1 overexpression plasmid that ChIP-qPCR with IgG (left) were performed as the control(right). D A schematic representation of the constructed 5'UTR region of HMGB1 containing E-box elements. E Luciferase reporter gene constructs were cotransfected with BMAL1 overexpression plasmid in 293T cells, and reporter gene activity was measured after 48 h by a dual luciferase assay. The relative value in 293T cells cotransfected with vector was set to 100%. F Western blot analysis of the indicated proteins in both controls, BMAL1-overexpressing and BMAL1-depleted HL60 and MOLM13 cells following treatment with RSL3 (1.0 μM) for 24 h. G The number changes of autophagosomes of both controls, BMAL1-depleted and BMAL1-HMGB1-depleted HL60 and MOLM13 were detected by transmission electron microscopy (TEM). n.s. (no significance), Statistical significance in (A–C) was calculated by two-way ANOVA with Dunnett’s multiple comparison test, and by one-way ANOVA with Dunnett’s multiple comparison test for (E).*p < 0.05; **p < 0.01; ***p < 0.001. ****p < 0.0001

