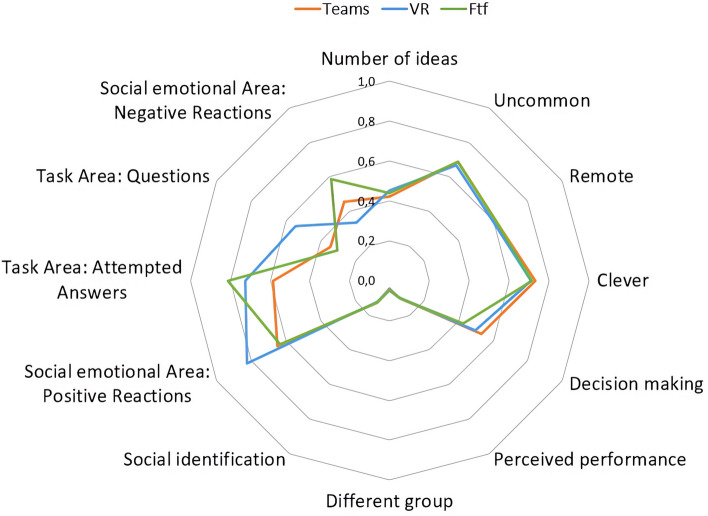
Figure 2.
Comparative analysis of creativity, decision-making, and interaction dynamic. This figure illustrates the mean scores for each interaction condition—face-to-face (FTF, represented by the green line), video call via Teams (represented by the red line), and virtual reality (VR, represented by the blue line)—in relation to creativity, decision-making, and the four quadrants assessed by the Bales Interaction Process Analysis grid35. Data normalization was performed to ensure comparability across variables that were measured on different scales.

