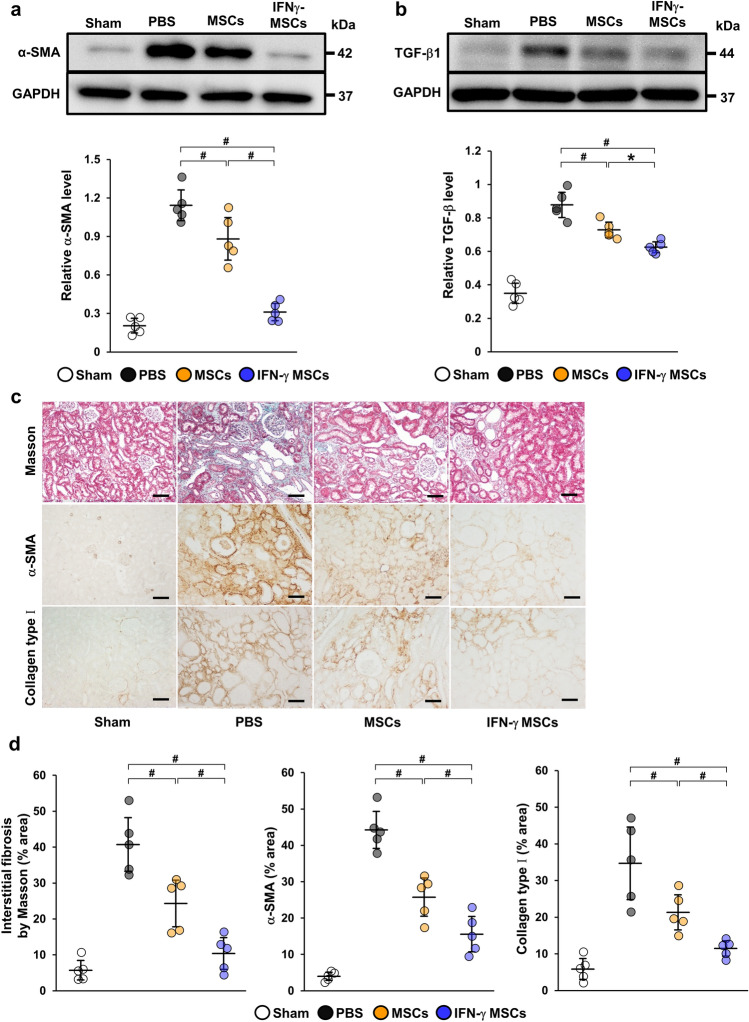
Figure 2.
Anti-fibrotic effects of IFN-γ MSCs in the kidney of IRI rats. Protein levels of fibrosis markers were evaluated at day 21 post-IRI by western blot (a, b), Masson’s trichrome staining and immunohistochemical (c) analyses. (a, b) Western blot analysis of α-SMA and TGF-β1 in the kidney cortex of IRI rats. Graphs show densitometric analyses of α-SMA and TGF-β1 expression levels normalized to the GAPDH expression level (n = 5 in each group). Full-length blots are presented in Supplementary Fig. 1b, 1c. (c) Representative images of Masson’s trichrome staining and immunohistochemical staining of α-SMA and collagen type I in kidney sections (scale bar = 100 µm). (d) Quantification of interstitial fibrosis area and α-SMA- and collagen type I-positive areas as percentages of the total area (n = 5 in each group). Data indicate mean ± S.D. #P < 0.01, *P < 0.05 (one-way ANOVA followed by Bonferroni’s post-hoc test).

