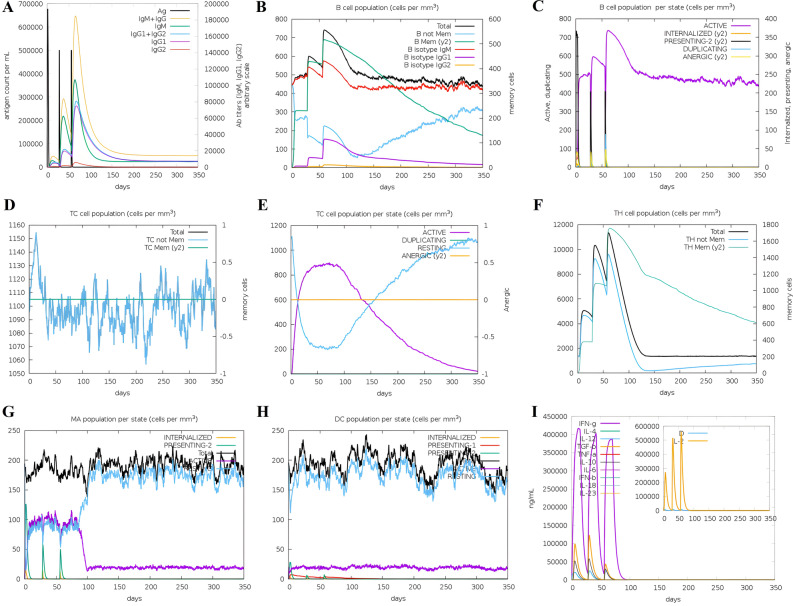
Figure 10.
In silico simulation of immune response triggered by the designed vaccine as an antigen after three subsequent injections. (A) Antigen and subtypes of immunoglobulin levels are represented as different colored peaks. The Immunoglobulin (IgG) production represents the proliferation of primary, secondary, and tertiary immune responses after the vaccine administration. (B,C) B lymphocytes by total count and population per entity state (active, presenting, internalized, duplicating, or anergic). (D) Cytotoxic T-cell population. (E) Cytotoxic T-cell population per state. (F) Helper T-cell population. (G) Macrophages population per state. (H) Dendritic cell population per state. (I) The concentration of cytokines and interleukins is at three different stages.

