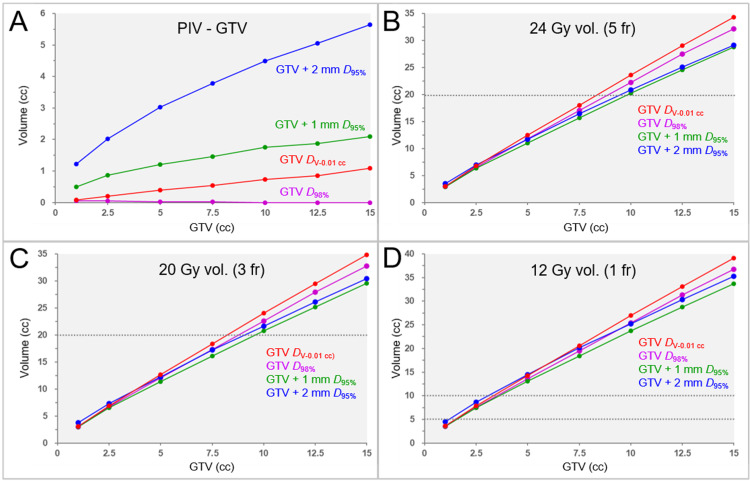
Figure 5. Correlations between GTV and the spillage volume of the prescribed dose outside the GTV, and GTV and the irradiated isodose volumes in four specific dose prescriptions based on BED.
The scatter plots show correlations between the GTV and the spillage volume of the prescribed dose outside the GTV (A); the GTV and the irradiated isodose volume (IIV), including the GTV, of 24 Gy in 5 fractions (B); the GTV and the IIV of 20 Gy in 3 fractions (C); and the GTV and the IIV of 12 Gy in 1 fraction (D). The specific dose prescriptions in 1, 3, and 5 fractions followed the examples shown in Table 4
A: The spillage volumes of the prescribed dose outside the GTV in dose prescription to the GTV D98% for the GTVs of 10.00, 12.50, and 15.00 cc are -0.02, -0.04, and -0.04 cc, respectively, and are displayed as zero for convenience
B,C: 24 Gy volume in 5 fractions and 20 Gy volume in 3 fractions of <20 cc (dashed lines) are associated with <10% risk of brain radionecrosis
D: 12 Gy volumes in 1 fraction of ≥5 cc and ≥10 cc (dashed lines) are associated with the risks of symptomatic brain radionecrosis of approximately 10% and 15%, respectively
GTV: gross tumor volume; BED: biologically effective dose; vol.: volume; fr: fraction(s); GTV + X mm: GTV evenly expanded by X mm; DV-0.01 cc: a minimum dose to cover a target volume minus 0.01 cc; DX%: a minimum dose covering at least X% of a target volume; BED10: biologically effective dose based on the linear-quadratic model with an alpha/beta ratio of 10

