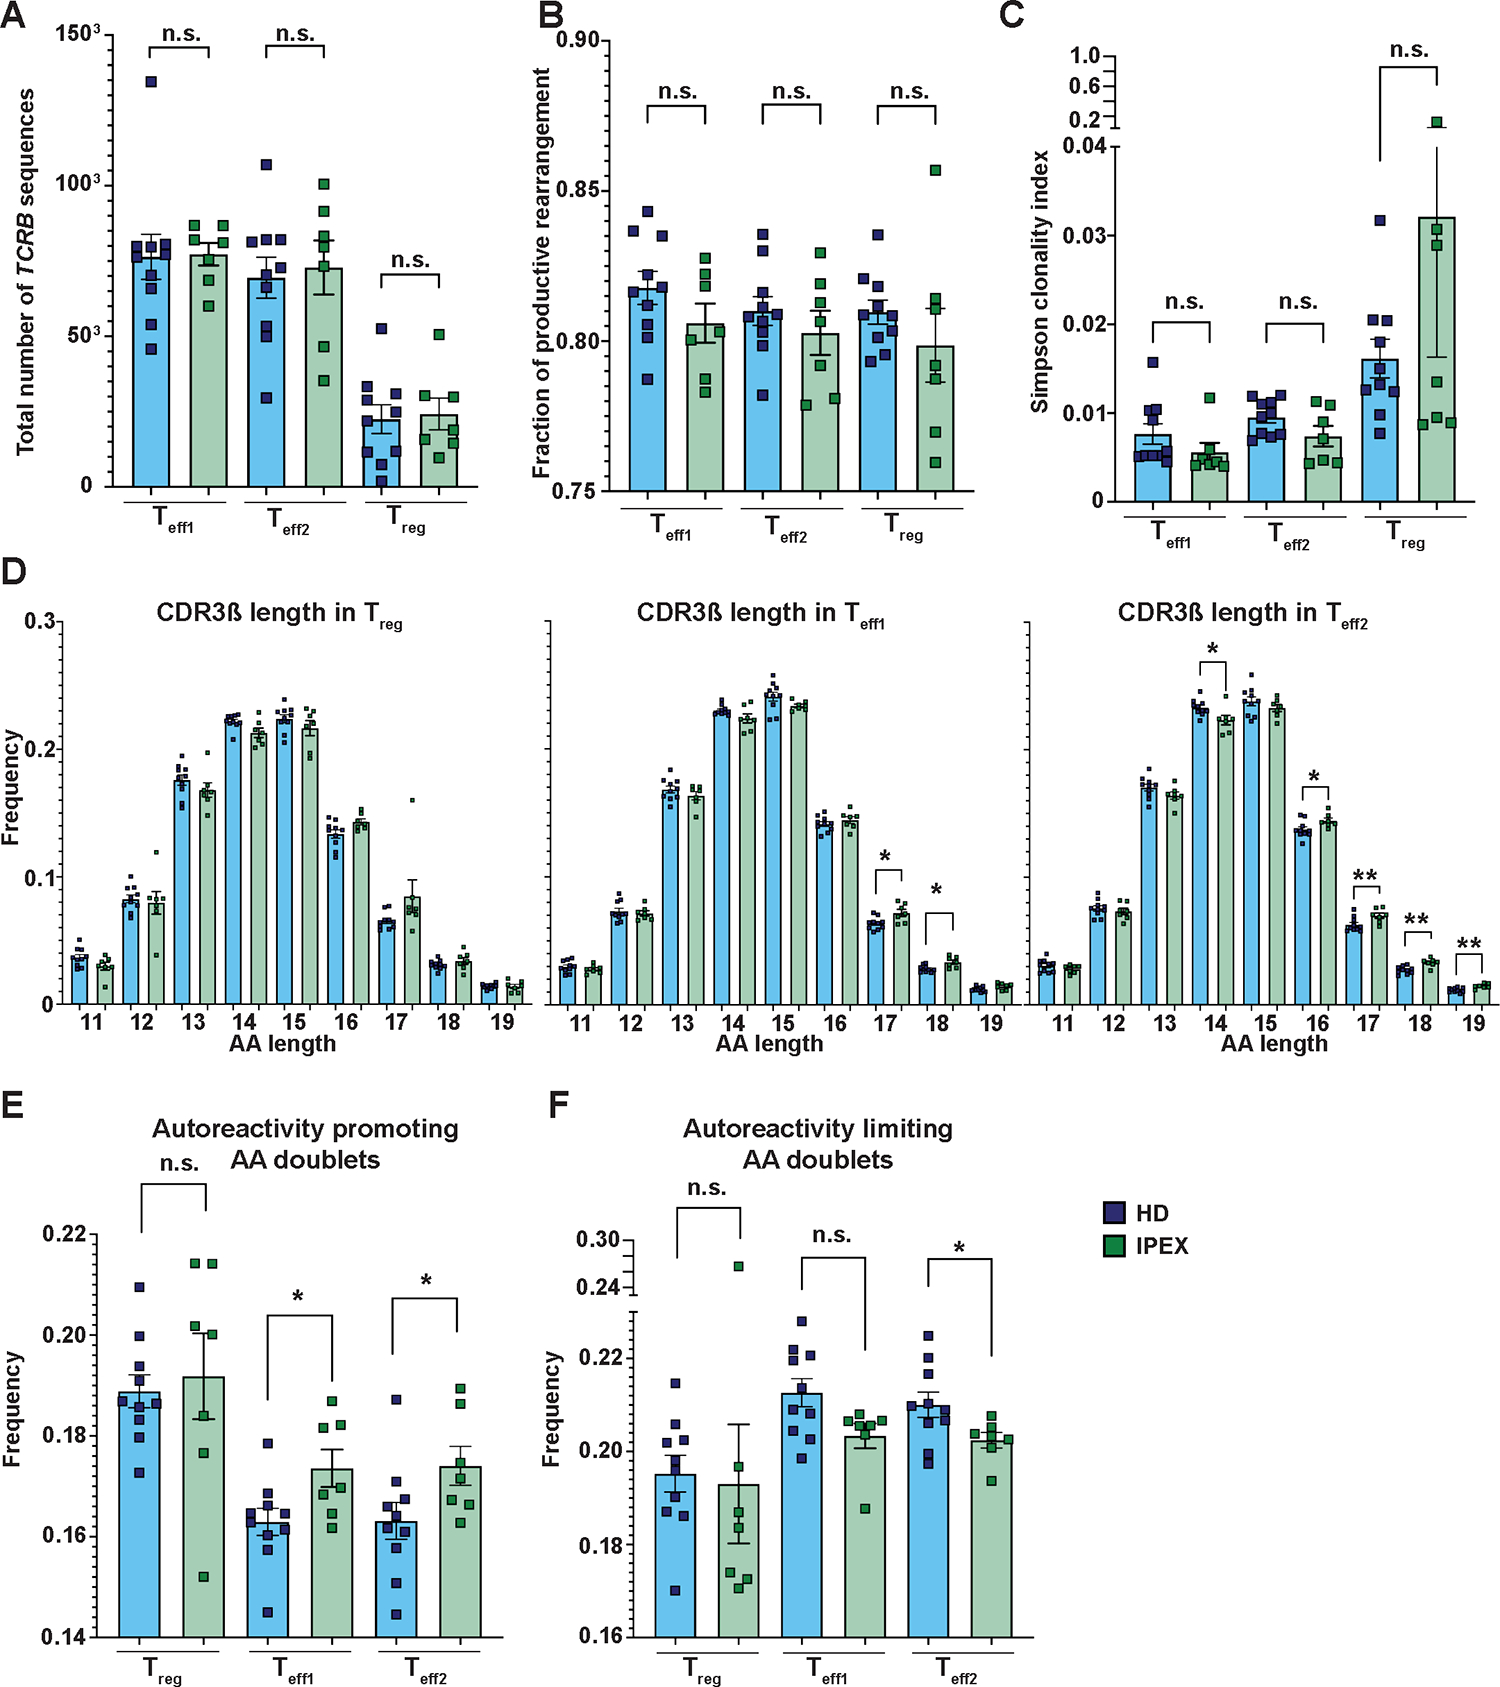
Figure 3. TCR analyses indicate increased TCR repertoire autoreactivity in patients with IPEX.

(A) Shown is the number of TCRB sequences that were identified in Teff1s, Teff2s, and Tregs from patients with IPEX (green) and HDs (blue). (B) Shown is the fraction of TCRB productive rearrangements for Teff1s, Teff2s, and Tregs from patients and HDs. (C) Shown is the Simpson clonality index for Teff1s, Teff2s, and Tregs from patients with IPEX and HDs. (D) Analysis of CDR3ß length of Tregs (left), Teff1s (middle), and Teff2s (right) from patients with IPEX and HDs. (E and F) Frequency of autoreactivity promoting (E) and autoreactivity limiting (F) AA doublets in CDR3ß sequences in Teff1, Teff2, and Treg populations from patients with IPEX and HDs. TCRB sequencing was performed in all three T cell subsets of 10 HD and 7 IPEX patients (A to F). Analyses in (C to G) were performed from productive rearrangements. Data are presented as mean ± SEM. Statistical significance was evaluated using the Mann-Whitney test; n.s., not significant; *p<0.05, **p<0.01.
