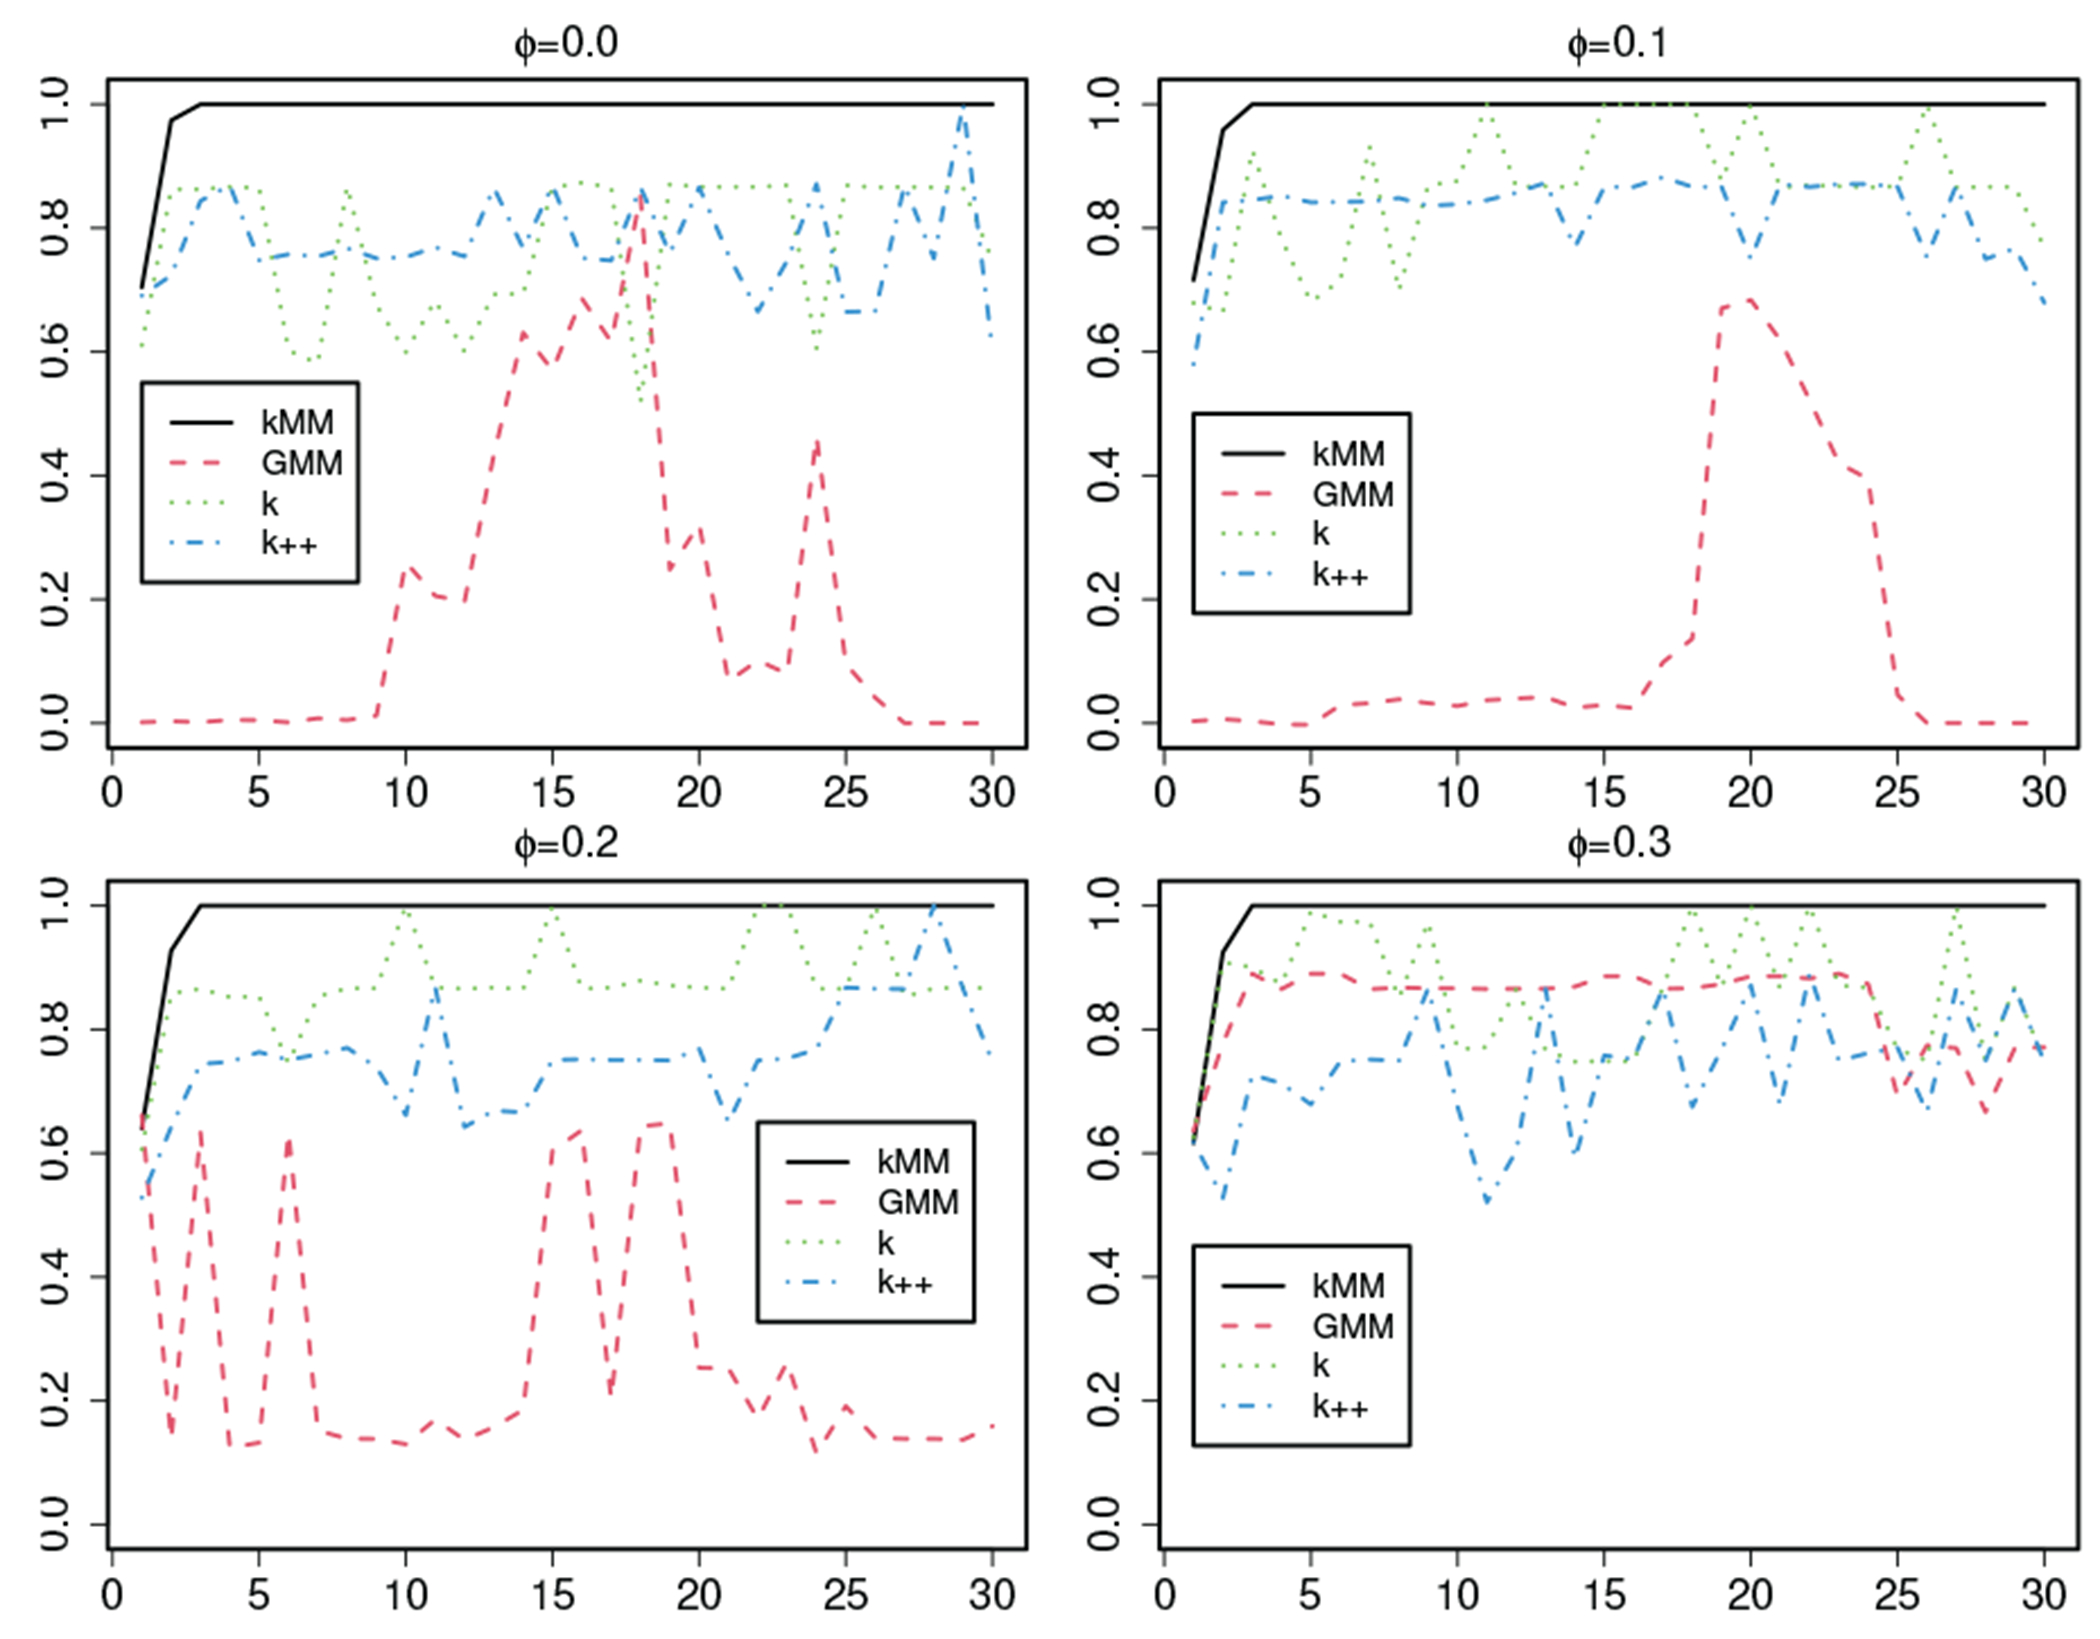
Fig. 1:

ARI curves obtained from a simulated dataset with feature sets selected by Algorithm 1 with respect to the -meansMM ( ), the GMM, the basic -means , and the -means++ () methods, where the horizontal axis represents the number of clusters and the vertical axis represents the ARI values.
