
Figure 3. Correlation of MC-AI–identified MC density and Histology Scoring System (HSS) scores across all disease states (−log 10–adjusted p values).
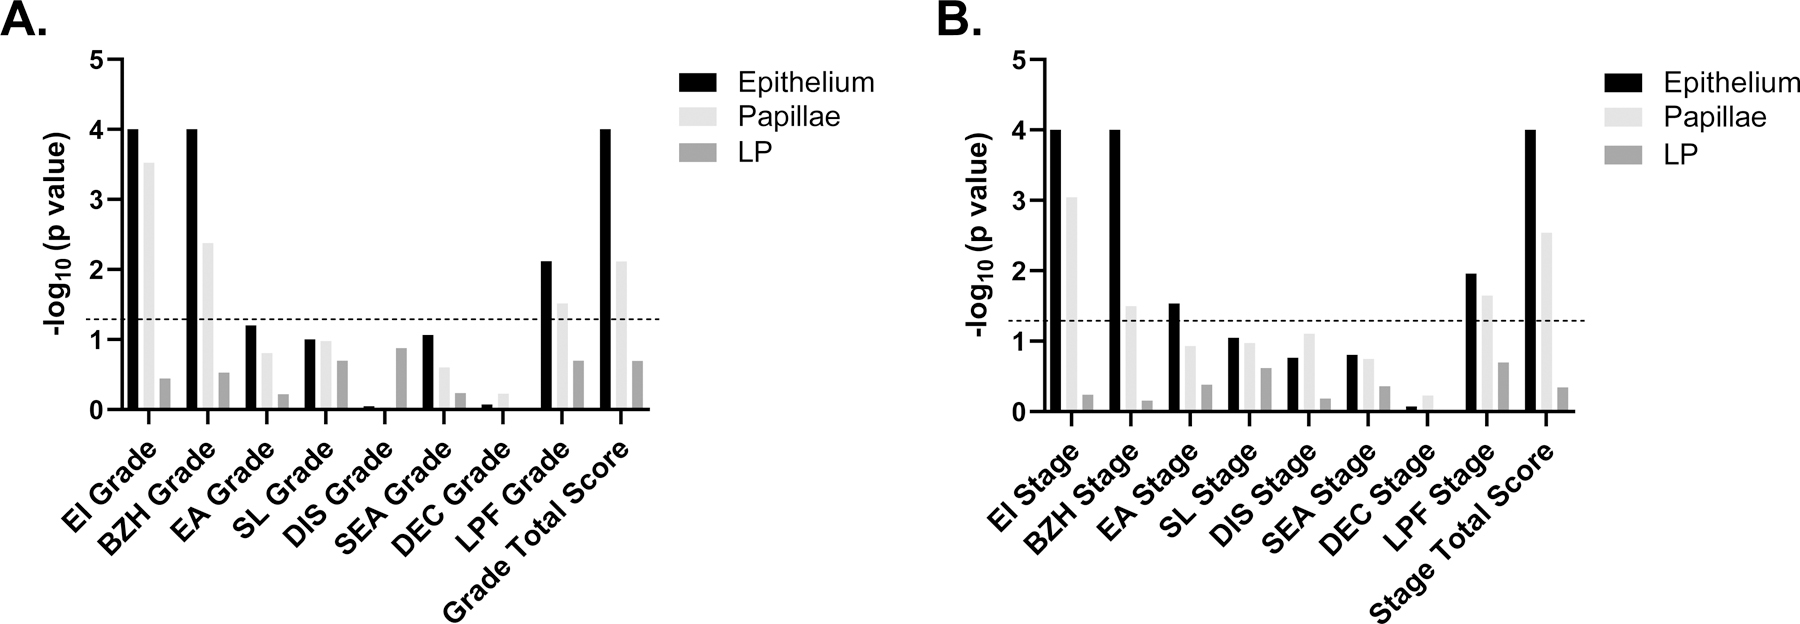
A. Histology Scoring System (HSS) grade scores. B. HSS stage. Dotted line represents −log 10–adjusted p value of 0.05. Simple linear regression was used for analysis. LP, lamina propria, EI, eosinophil inflammation, BZH, basal zone hyperplasia, EA, eosinophil abscess, SL, eosinophil surface layering, DIS, dilated intercellular spaces, SEA, surface epithelial alteration, DEC, dyskeratotic epithelial cells, LPF, lamina propria fibrosis.