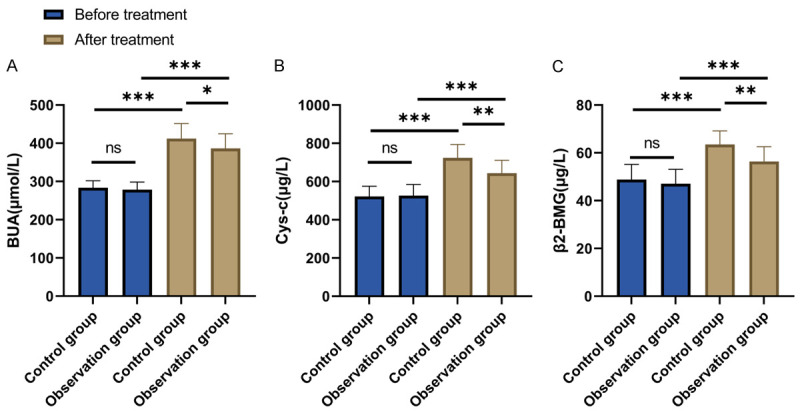
Figure 2.

Changes in renal function of patients before and after treatment. A. Comparison of BUA changes before and after treatment between the two groups of patients; B. Comparison of Cys-c changes before and after treatment between the two groups of patients; C. Comparison of changes in β2-BGM before and after treatment between the two groups of patients. Note: nsP>0.05, *P<0.05, **P<0.01, ***P<0.001; BUA, blood uric acid; Cys-c, serum cystatin-c; β2-BMG, β2 microglobulin.
