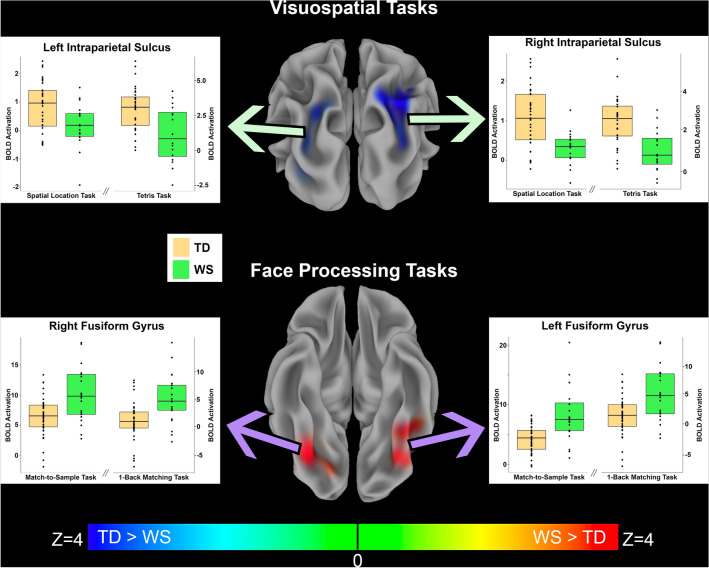
Figure 2.
Functional activation differences between children with WS compared to typically developing children in response to visuospatial tasks and face processing tasks. Top row Middle image displays a posterior view of the inflated brain surface with overlaid between-group meta-Z statistics of the two visuospatial tasks combined, showing bilateral hypoactivation of the intraparietal sulcus (IPS) in participants with WS (TD > WS, p < 0.001 FWE corrected). Green arrows point to plots of the average extracted BOLD from the identified significant IPS clusters for individuals with WS and TD controls for both visuospatial processing tasks, separately. Plots show that TD participants had greater activation than children with WS in the Spatial Location Task and the Tetris Task in both the right and left IPS regions. Bottom row Middle image displays an inferior view of the inflated brain surface with the overlaid color representing the between-group meta-Z statistics for both face processing tasks combined, showing bilateral hyperactivation of the fusiform gyri in children with WS (WS > TD, p < 0.001 FWE corrected). Purple arrows point to plots of the average extracted BOLD from the identified significant fusiform clusters for individuals with WS and TD controls for the two face processing tasks separately. Plots show that children with WS had greater activation than TD children in both the Match-to-Sample Face Task and the One-Back Face Matching Task in both the right and left fusiform regions.

