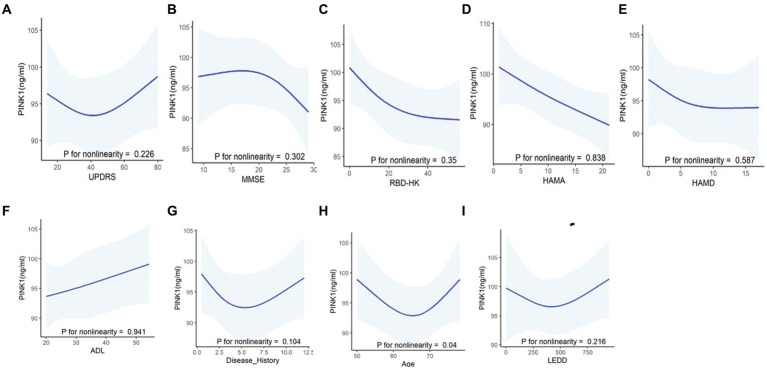
Figure 5.
Correlations between PINK1 levels and clinical assessments in PD patients using the restricted cubic spline curves (RCS) fitting model. Using non-linear smoothing spline regressions RCS model between PINK1 as a continuous value and neuropsychological evaluation scales including UPDRS (A), MMSE (B), RBDQ-HK (C), HAMA (D), HAMD (E), and ADL (F) and other clinical values such as disease history (G) and LEDD (I) after adjusting age, sex, and education. The correlation between PINK1 level and age (H) was assessed after adjusting sex and education. p > 0.05, indicating lack of correlation of the tested values.

