Figure 6.
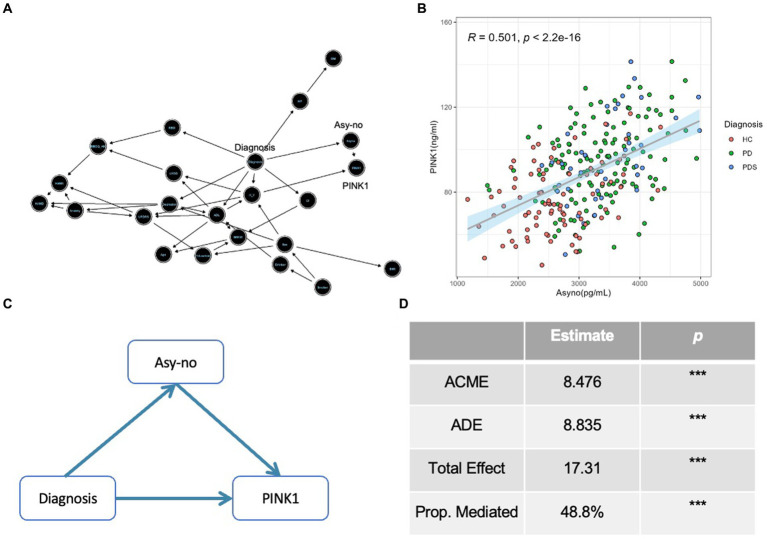
The Diagnosis-Asyno-PINK1 pathway was validated in different analyses. (A) A directed acyclic graph (DAG) based on the Bayesian network was used to assess the causal relationship among different covariates including demographic characteristics (sex, age, BMI, education, smoker, drinker, hypertension pressure as well as diabetes mellitus), neuropsychological assessments (MMSE, HAMA, HAMD, ADL, UPDRS, H-Y stage, and RBDQ-HK), non-motor status according to neuropsychological assessments (cognitive impairment, depression, anxiety, and RBD), LEDD, and diagnosis. (B) A curve of linear regression was used to show the relationship between PINK1 and Asy-no levels. The correlation coefficient (r) and p value were assessed by Pearson correlation. (C) A diagram of mediation effect analysis was used to show the Diagnosis-Asyno-PINK1 pathway and the proportion of mediation effect is 48.8% (D). ACME, Average causal mediation effect; ADE, Average direct effect; Prop. Mediated, proportion mediated; *p < 0.05, **p < 0.01, and ***p < 0.001 in mediation effect analysis.

