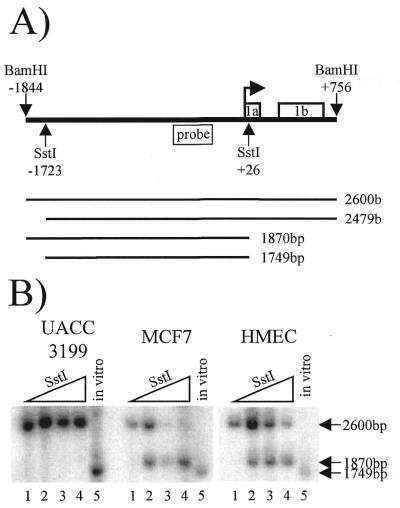
Figure 4.
SstI chromatin accessibility assay of the BRCA1 5′ region. (A) A schematic showing the in vivo SstI and in vitro BamHI restriction sites relative to the BRCA1 transcription start site (bent arrow), the BRCA1 probe, exons 1a and 1b, and the four possible in vivo SstI cleavage products and their predicted sizes. (B) A Southern blot that shows each cell type and the resultant in vivo SstI digest products. The lanes, from left to right, are 0, 25, 75 and 225 U of SstI; the in vitro control SstI digest is shown in the fifth lane of each cell type. This experiment was performed three times with similar results.

