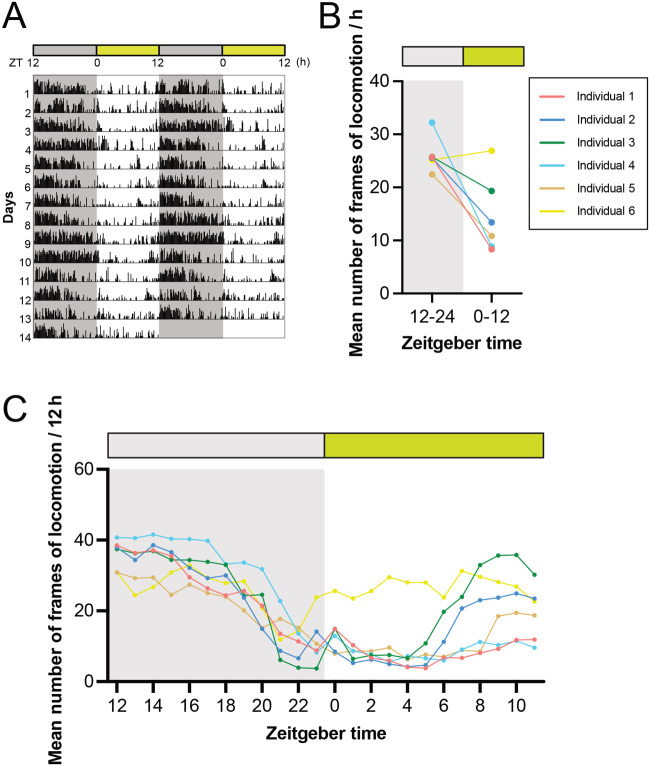
Fig. 3.
A quantitative analysis of locomotion of crickets. (A) The double-plotted actogram recorded under a 12-h light:dark (LD) cycle at 30°C for 14 days shows that the frequency of locomotion increases during the dark phase. (B,C) Mean number of frames of locomotion for 12 h (B) and 1 h (C) indicated that locomotion significantly increases during the dark phase (1 frame per min).

