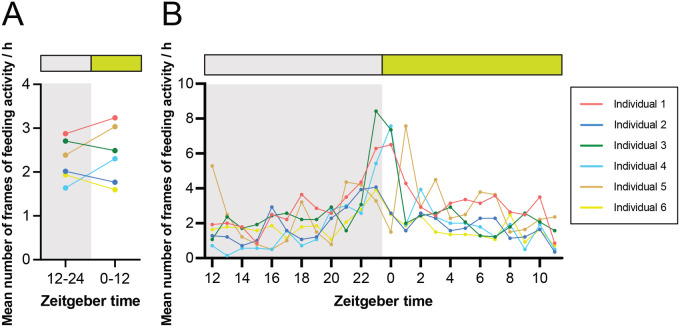
Fig. 4.
A quantitative analysis of feeding activity of crickets. (A,B) Mean number of frames of feeding activity for 12 h (A) and 1 h (B) suggested that peaks were evident around the transition from dark to light, though there was no significant difference in feeding activity between the dark and light phases (1 frame per min).

