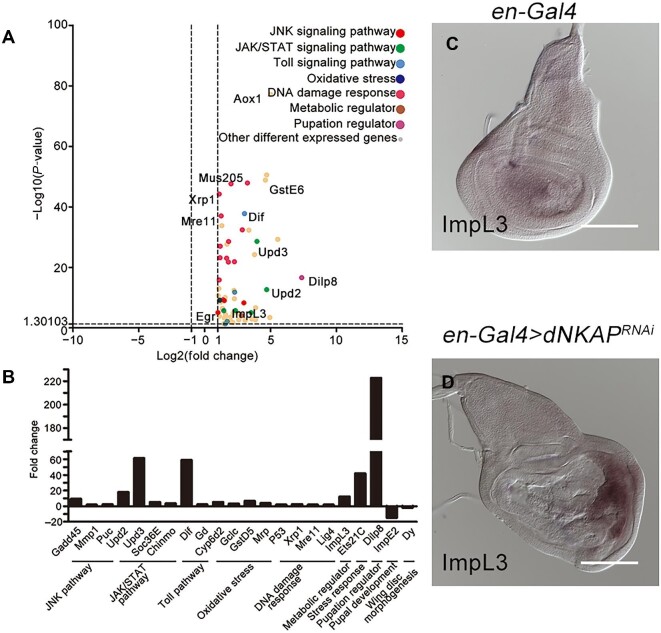
Figure 6.
Transcriptome analysis of dNKAP-knockdown tissues. (A) RNA-Seq dataset of differentially expressed genes in dNKAP-knockdown wing discs compared to the control discs. Pathways activated in dNKAP-knockdown tissues are highlighted. (B) qPCR analysis of selected differentially expressed genes in dNKAP-knockdown tissues. Fold changes represent the expression levels in dNKAP-knockdown wing discs relative to the control discs. Data shown are the average values from three technical replicates. (C and D) Increased expression of ImpL3 in dNKAP-knockdown wing discs. Scale bar, 100 μm.

