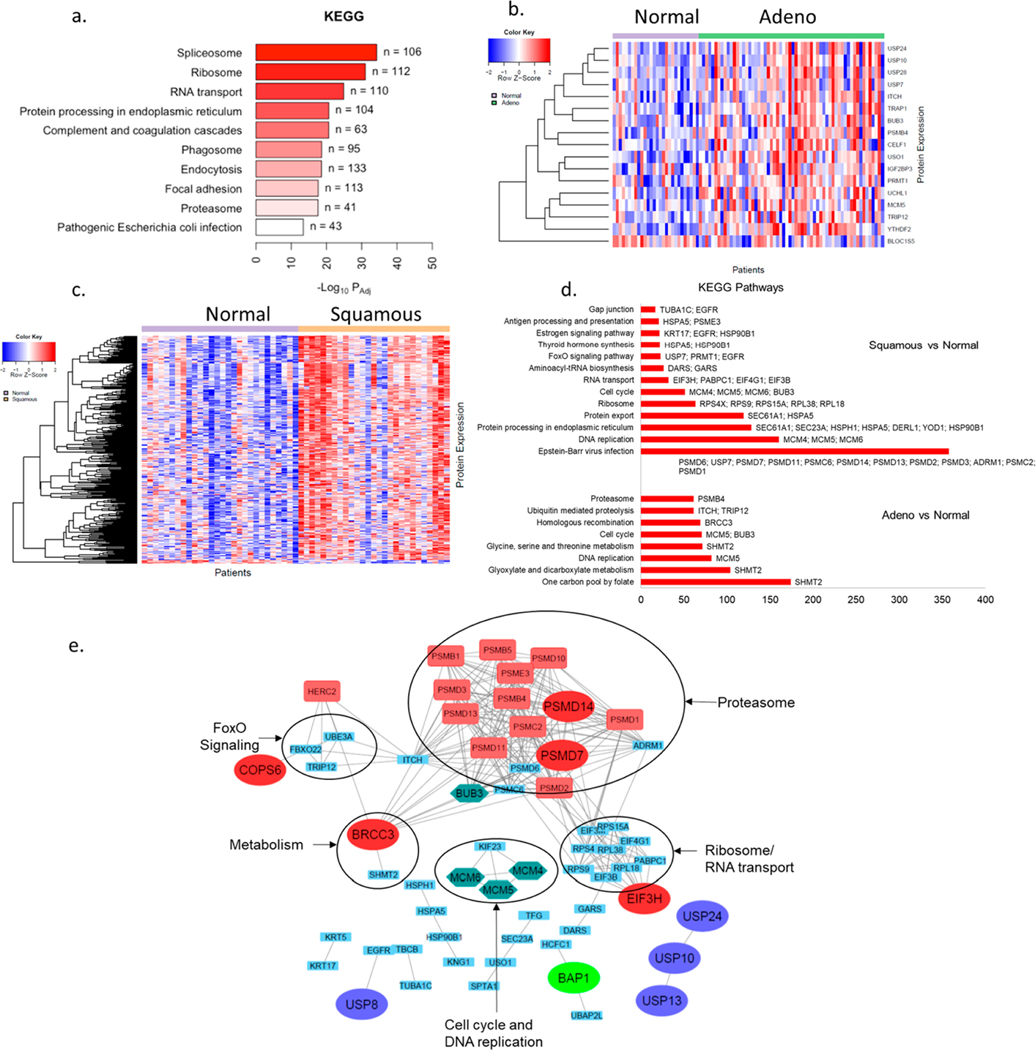
Figure 2.
Pathway analysis for DUBs and DIPs in NSCLC tumors: (a) KEGG pathway analysis of all proteins identified in tumor ABPP. (b) Heat map for 19 differentially expressed DIPs of differentially active DUBs in adenocarcinoma versus NTA. (c) Heat map for 75 differentially expressed DIPs of differentially active DUBs in squamous carcinoma versus NTA. (d) Major pathways identified using KEGG pathway analysis of differentially expressed DIPs in adenocarcinoma and squamous carcinoma versus NTA. (e) STRING database association between differentially active DUBs in either of the tumor subtypes vs NTA and their differentially expressed DIPs. DUBs belonging to different subfamilies are represented by enlarged ovals of different colors. Proteins in the green hexagon are involved in cell cycle and DNA repair pathways. Proteins in red rectangles represent contributors to the G2/M cell cycle checkpoint.

