FIG. 2.
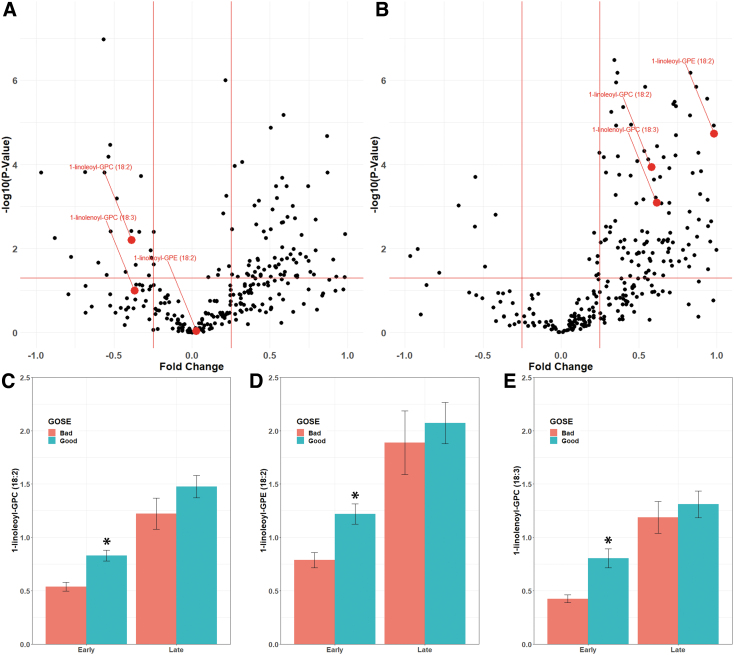
Changes in lipid metabolites over time after injury. Volcano plots of 24 h (A) and 3-month (B) changes after mild traumatic brain injury (mTBI). Fold changes are depicted comparing mTBI to controls. Metabolites found to be significantly higher in subjects with good outcomes (1-linoleoyl-GPC [18:2], 1-linoleoyl-GPE [18:2], and 1-linolenoyl-GPC [18:3]) are shown in red. Levels of each metabolite are shown in C–E. Levels are shown early (within 24 h) and late (3 months) after injury for those with bad (Glasgow Outcome Scale [GOSE] ≤6, red) and good (GOSE ≥7, blue) outcomes. *p < 0.001.

