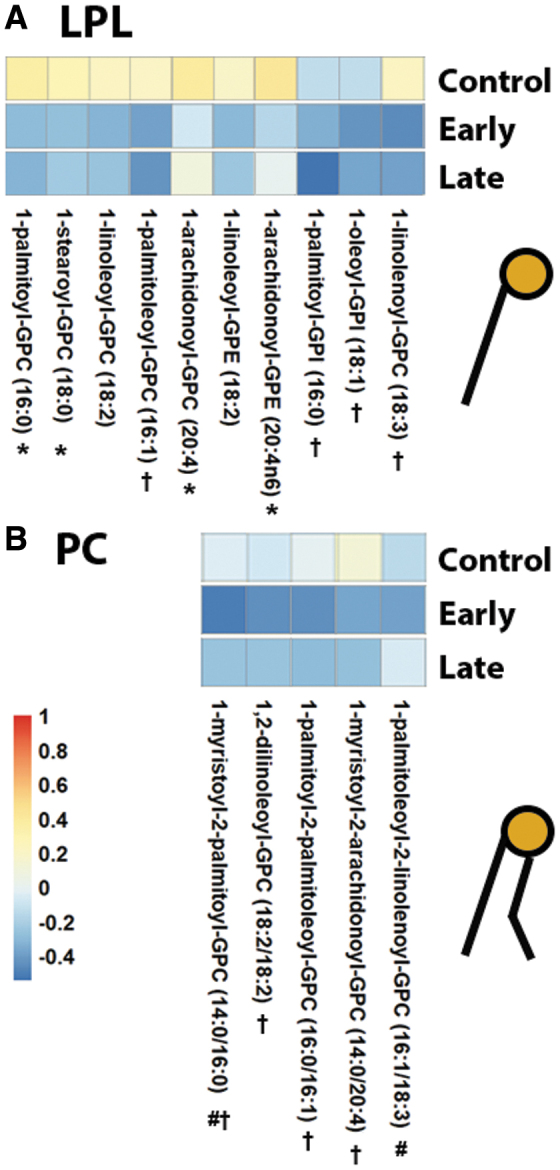
FIG. 3.

Associations between plasma choline and phospholipids. Each pixel represents a correlation coefficient corresponding to the phospholipid in that column and choline. Red, blue, and white coloring indicate positive, negative, or near-zero correlations. Correlations are shown between lysophosphlipids (LPL) and choline (A) and phosphatidylcholines (PC) and choline (B). *p < 0.05 in controls, #p < 0.05 early after mild traumatic brain injury (mTBI), †p < 0.05 late after mTBI.
