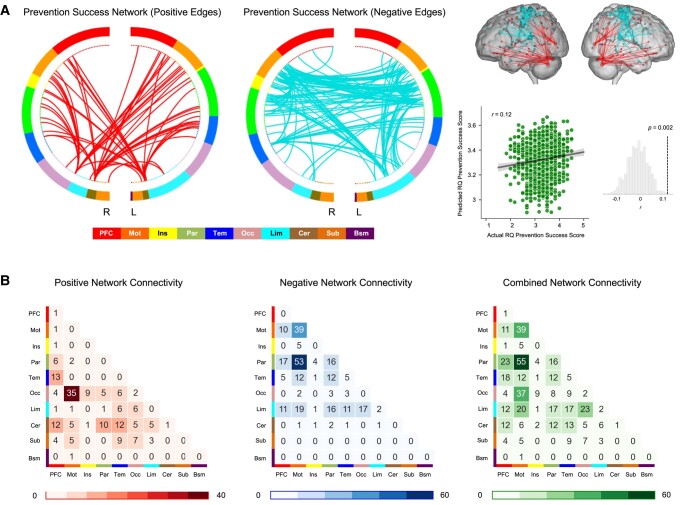
Fig. 1.
Connectome-based prediction model of prevention success. A) Combined positive and negative networks contributed to the prediction of prevention success (P = 0.002; 1,000 permutations). B) Contributions of each of 10 functional networks to prevention success prediction, summarized by positive, negative, and combined networks. The numbers in each cell denote the number of edges for each pair of networks. PFC, prefrontal cortex; Mot, motor cortex; Ins, insula; Par, parietal cortex; Tem, temporal cortex; Occ, occipital cortex; Lim, limbic cortex; Cer, cerebellum; Sub, subcortical regions; R, right; L, left.

