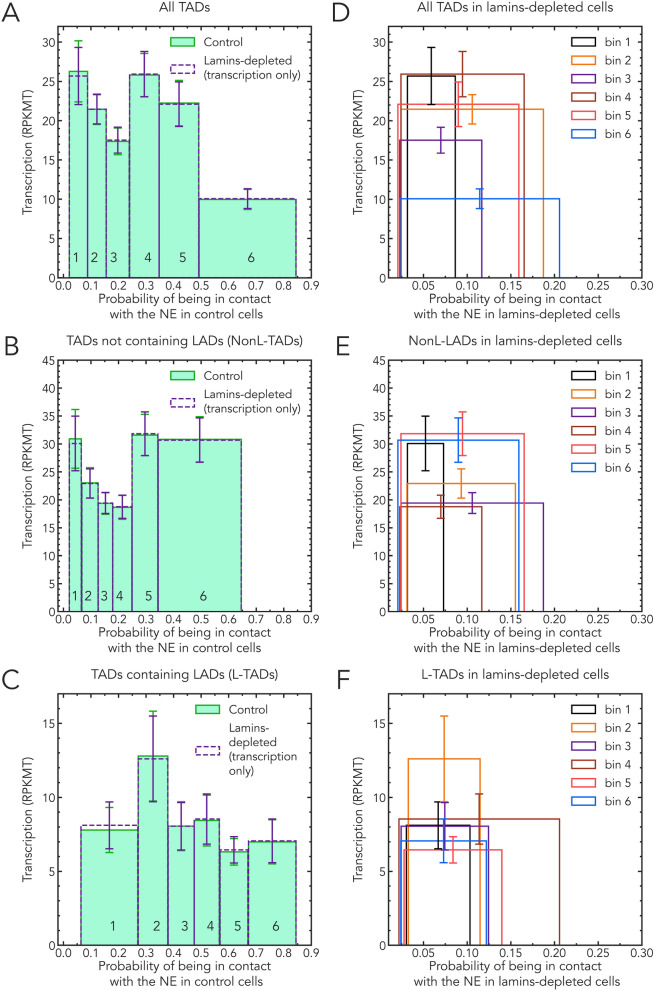
Fig. 3.
Dependencies of bin averaged TAD transcription levels (in ) on the probability of TADs in the bin to be in contact with the NE. Virtually no change in the transcription levels—bin heights—is seen in lamins depleted cells compared to control. The binning of TADs is based on TAD-NE contact probabilities in control cells for each set (selection) of TADs. Solid bars: control cells. Empty bars: lamins-depleted cells. The same set of TADs per bin is used in the control and lamins-depleted cells. Error bars are s.e.m. (standard error of the mean). Left panels: A all TADs; B TADs not containing LADs (NonL-TADs); and C TADs containing LADs (L-TADs). In the left panels only, the positions of the empty bins (lamins-depleted cells) along the x-axis are deliberately kept unchanged to facilitate visual comparison of the bin heights between lamins depleted and control bins. Right panels show only lamins-depleted cells: D all TADs; E TADs not containing LADs (NonL-TADs); and F TADs containing LADs (L-TADs). A clear shift of the average TAD positions away from the NE is evident

