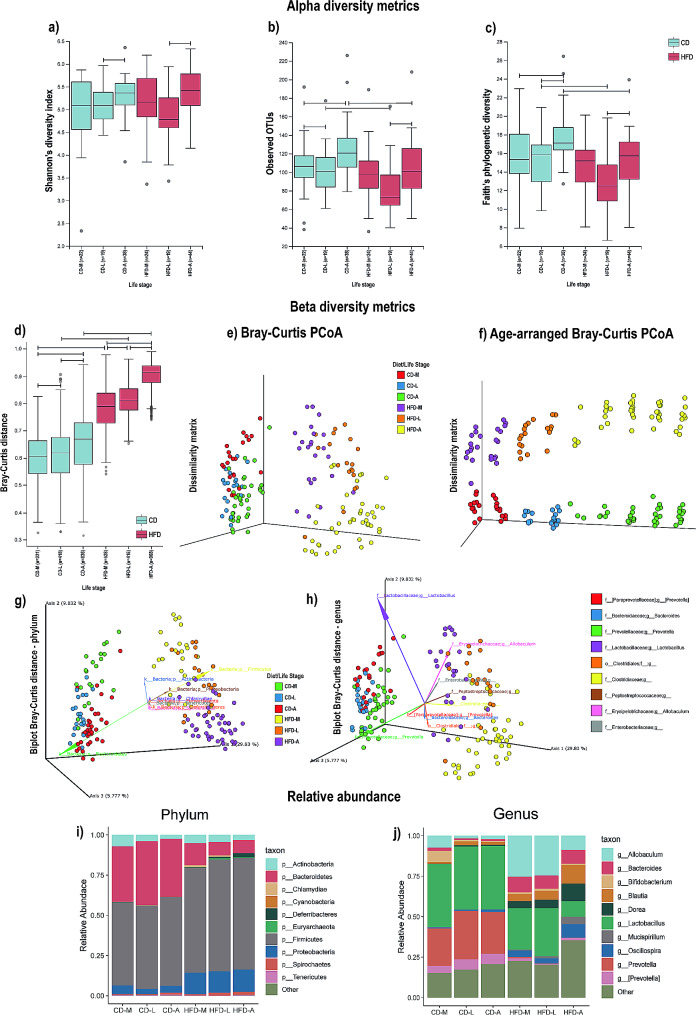
Fig. 2.
Effects of high-fat diet (HFD) on alpha diversity, beta diversity, and community composition of the gut microbiome across mid-adolescence, late adolescence, and adulthood. Alpha diversity as measured by (a) Shannon’s diversity index, (b) Observed OTUs, (c) Faith’s phylogenetic diversity. (d) Beta diversity distance comparison plot with box plots illustrating distances within and between a single treatment group using Bray-Curtis distance, (e) Bray-Curtis principal coordinates (PCoA) plot of dissimilarity matrix (phylum level), and (f) age-arranged Bray-Curtis PCoA plot of dissimilarity matrix (phylum level). Biplot using Bray-Curtis distance for (g) phylum and (h) genus, illustrating microbial community analysis and composition (vectors) using principal component analysis of center log ratio transformed and standardized data from CD and HFD groups. Vectors point in the direction of the greatest increase of values for corresponding phylum and genus. Top ten taxa with highest relative abundances, illustrated by stacked vertical bar charts for (i) phylum and (j) genus. Data are expressed as means ± SEMs, p < 0.05; Kruskal–Wallis H test and PERMANOVA pairwise test. Abbreviations: CD-A, control diet group/adulthood; CD-L, control diet group/late adolescence; CD-M, control diet group/middle adolescence; HFD-A, high-fat diet group/adulthood; HFD-L, high-fat diet group/late adolescence; HF D-M, high-fat diet group/middle adolescence; pnd, postnatal day

