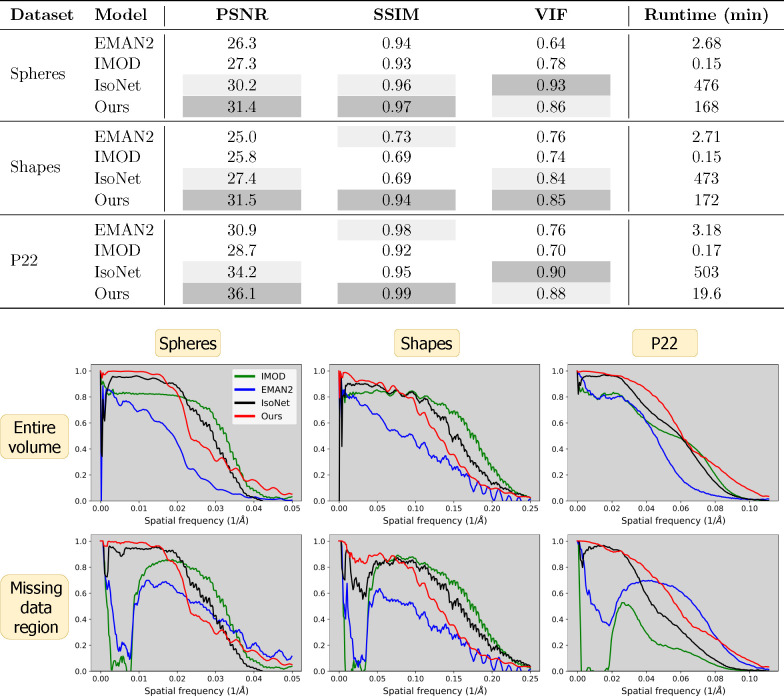
Figure 4 |.
Image quality metrics across all datasets and models. Top: Voxel-based metrics and algorithm runtime. Ours (CN) generally performs best except for the VIF metric, which measures high frequencies. Due to pretraining, IsoNet is the most computationally intensive. Bottom: Fourier shell correlation (FSC) curves for each dataset (columns) across the entire volume (top row) and missing data region (bottom row). Ours typically performs best at lower frequencies and is surpassed at higher frequencies. Only ours and IsoNet provide substantive information at lower frequencies.

