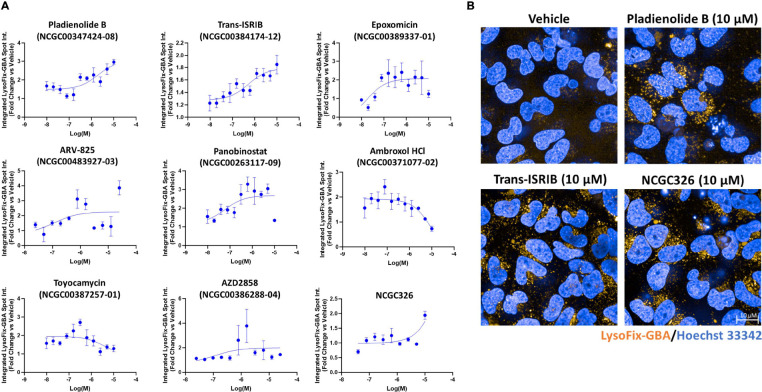
Figure 3. A high-content imaging-based secondary assay using the fluorescence-quenched substrate LysoFix-GBA quantifies GCase activity in the lysosome.
Lysosomal activity of GCase was directly visualized using the optimized LysoFix-GBA secondary assay in live HiBiT-GCase-L444P H4 cells treated with vehicle (DMSO) or hit compounds. H4 cells were seeded into 384-well PerkinElmer PhenoPlates (25,000 cells in 40 μL media) and incubated for 24 h. Thereafter, the cells were treated with a titration of compounds for 24 h and then incubated with LysoFix-GBA (5 μM) for 2 h at 37°C and 5% CO2. High-content imaging was performed after 15 min of nuclear staining with Hoechst-33342 (1 μg/mL) in Fluorobrite media. (A) Select hits from the primary screen were tested in a dose-response titration series. Data are represented as the fold change (compound-treated vs. DMSO-treated) in integrated LysoFix-GBA spot intensity per cell. Dose-response curves were fit using log(agonist) vs. response (three parameters). (Error bars: SEM [n = 3 – 6]). (B) Representative images are shown for pladienolide B, trans-ISRIB, and NCGC326 at their most effective concentrations in the LysoFix-GBA assay.

