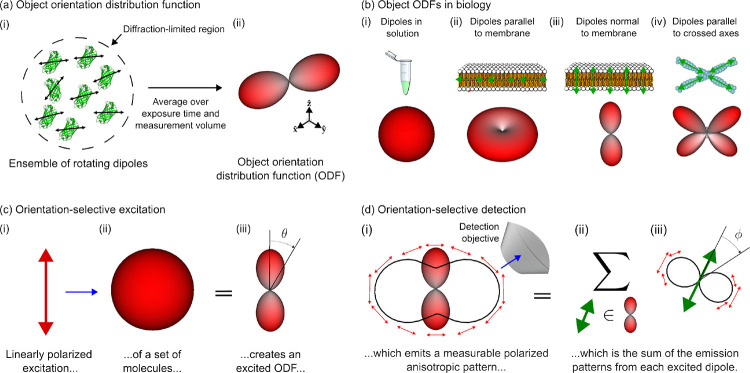
Fig. 1. Orientation distribution functions (ODFs) can model ensembles of oriented fluorophores that label biological structures, their excitation, and their detection.
(a) (i) Fluorescent samples consist of molecules that move and rotate in three dimensions (e.g. green fluorescent protein molecules pictured), and many of the most common fluorescent molecules’ excitation and emission behavior can be described by a single 3D dipole axis (double-sided black arrows overlaid on each molecule). Our instrument excites and measures emissions from diffraction-limited regions that contain many fluorescent molecules (dashed circle), so (ii) we simplify our model of individual emitters to a coarse-grained model called an object orientation distribution function (ODF). An ODF is a spherical function that we depict as a surface with a radius proportional to the number of dipoles in the measurement volume that are oriented along each direction. (b) Dipole distributions (top row) can be modelled by object ODFs (bottom row). (i) Fluorescent dipoles in solution typically rotate rapidly during the measurement time of fluorescent microscopes, so the corresponding ODFs are isotropic, depicted as a surface with constant radius. (ii-iv) When fluorescent dipoles (green double-sided arrows) are spatially and rotationally constrained, their corresponding object ODFs report the orientation of labelled biomolecules. (c) We can probe an object ODF by exciting a subset of molecules with polarized light. For example, when (i) linearly polarized light (red arrow) illuminates (blue arrow) an (ii) isotropic object ODF, (iii) the resulting subset of excited molecules, which we call an excited ODF, will have a dependence where is the angle between the incident polarization and the excitation dipole moment of the individual fluorophores in the distribution. Selectively exciting molecules creates contrast between different object ODFs. (d) We can create more contrast by selectively detecting an excited ODF’s emissions. (i) An excited ODF (red glyph) emits a polarized emission pattern (red arrows, perpendicular to the emission direction) that is anisotropic (solid black line, radius is proportional to the emitted power along each direction) which encodes information about the excited ODF. Selectively detecting emissions with an objective (blue arrow) creates contrast between excited ODFs. (ii) The emission pattern in (i) is the sum () of the emissions from each dipole (green double-sided arrow) in the excited ODF. (iii) Similar to (i), each dipole emits a polarized emission pattern that is anisotropic, with each dipole emitting in a intensity pattern where is the angle between the emission dipole moment and the emission direction.

