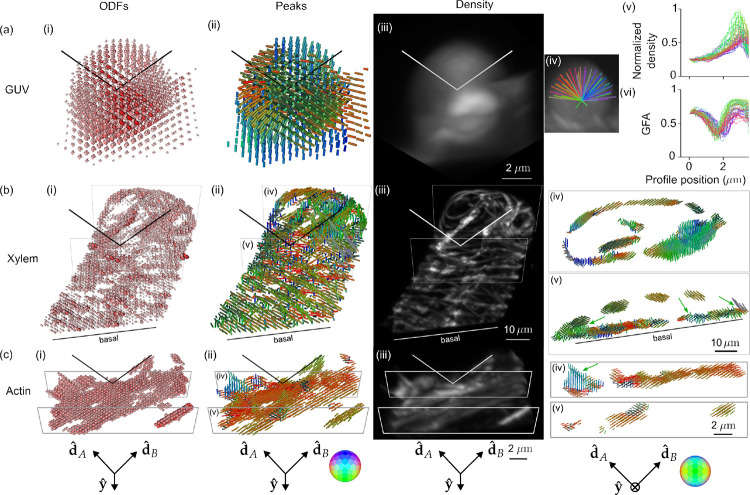
Fig. 4. Reconstruction of GUV, xylem, and actin samples validate pol-diSPIM’s accuracy and extend known 2D orientation results to 3D.
(a) A ~ 6 μm-diameter GUV labelled with FM1–43 with (i) ODFs and (ii) peak cylinders separated by 650 nm. Radial profiles through the density map (iv) are used to plot density (v) and (vi) generalized fractional anisotropy (GFA) as a function of distance from the center of the GUV. (b) A xylem cell with its cellulose labelled by fast scarlet with (i) ODFs and (ii) peak cylinders separated by 1.56 μm. Slices (iv, v) show peak cylinders separated by 650 nm and depict the dipole orientations tracking parallel to the helical cellulose structure, with different orientations on the basal and apical surfaces and spatially merging fibers distinguishable by their orientations (green arrows). (c) U2OS cells with actin labelled by phalloidin 488 with (i) ODFs and (ii) peak cylinders separated by 390 nm. Slices (iv, v) show peak cylinders separated by 260 nm and depict out-of-plane (green arrow) and variable in-plane orientations of fixed actin. Each column’s camera orientation and orientation-to-color map is displayed in the bottom row. See also, Supplemental Movies M1–6.

