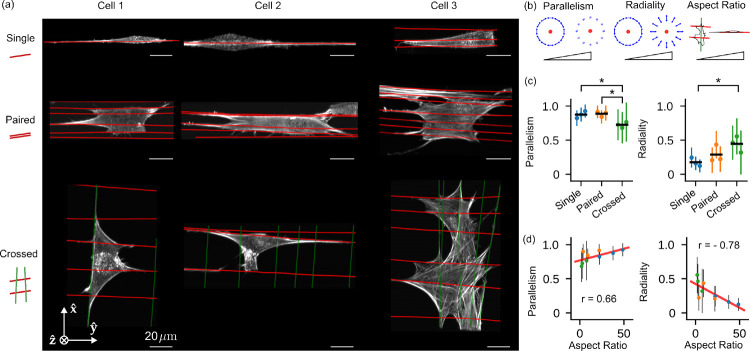
Fig. 6. Measurements of 3T3 mouse fibroblasts grown on different nanowire arrangements show correlations between voxel- and cell-scale orientations.
(a) Reconstructed density maximum intensity projections of three cell repeats (columns) grown on varying nanowire arrangements (rows) named “Single”, “Paired”, and “Crossed” (cartoons at left). Wires are overlaid as red and green lines. (b) We collected reconstructed peak directions in voxels that were < 5 μm from a wire and had total counts > 5000, calculated their parallelism and radiality with respect to their nearest wire (see inset cartoons where the red dot indicates a wire, and blue arrows indicate the neighboring peak directions for strongly parallel and radial peaks), and plotted their mean (dots) and standard deviation (error bars) for each cell and nanowire arrangement (colors). Additionally, we calculated each cell’s “Aspect Ratio”, the ratio of the largest and smallest eigenvalues of the cell’s moment of inertia tensor (with the reconstructed density as a proxy for mass). (c) We compared population means (horizontal black lines) with a t-test and marked p < 0.05 - significant differences with asterisks. (d) We compared our local voxel-wise parallelism and radiality metrics to the cell’s global aspect ratio. We found positive and negative correlations between the aspect ratio and the parallelism and radiality, respectively, indicating local-global correlations in cellular behavior. Colored dots match (c), the red line is a linear fit to all nine data points, and the annotated r values are Pearson correlation coefficients.

