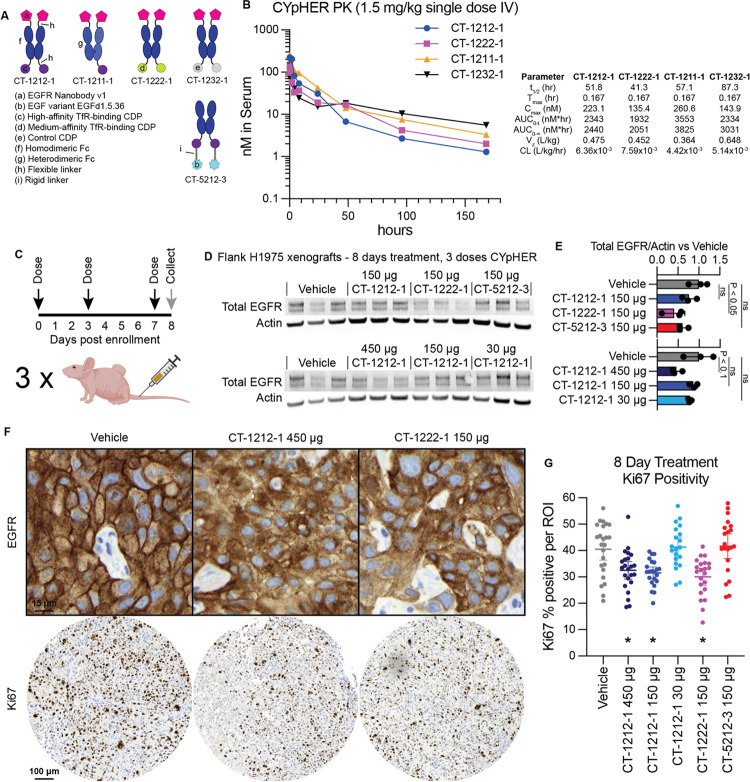
Fig. 8. Pharmacokinetics and pharmacodynamics of CYpHER in mice.
(A) Designs of various EGFR CYpHERs and control molecules. (B) NCr nu/nu mice were dosed with 1.5 mg/kg CT-1212-1, CT-1211-1, CT-1222-1, or CT-1232-1 IV. Serum samples were taken after 10 min, 30 min, 1 hr, 2 hr, 4 hr, 8 hr, 24 hr, 48 hr, 96 hr, or 168 hr. Three mice per time point were analyzed. Serum samples were quantitated by ELISA for human Fc domain in technical triplicate. Molecules exhibited a normal biphasic distribution curve, and as such, PK parameters were determined by non-compartmental analysis for IV bolus dosing using PKSolver 2.0. (C) Experimental design for tumor implantation and dosing. Female athymic nude mice (Foxn1nu) were implanted (subcutaneous flank) with 5×10⁶ H1975 cells. After 21 days, mice were enrolled and dosed IV on days 0 (enrollment day), 3, and 7. On day 8, tumors from three mice per dosage group were harvested and split in half for Western blot lysis or for histology. (D) Western blot analysis of total EGFR and actin. (E) Quantitation of the blots from (D). (F) IHC (hematoxylin/DAB) for total EGFR (top) and Ki67 (bottom) in vehicle, CT-1212-1 450 μg, and CT-1222-1 150 μg groups. Full EGFR fields can be found in fig. S7. (G) Quantitation of Ki67 positivity, derived from 6–9 regions of interest (ROI) per tumor, three tumors per group, pooled for analysis. *: P < 0.01 vs vehicle.

