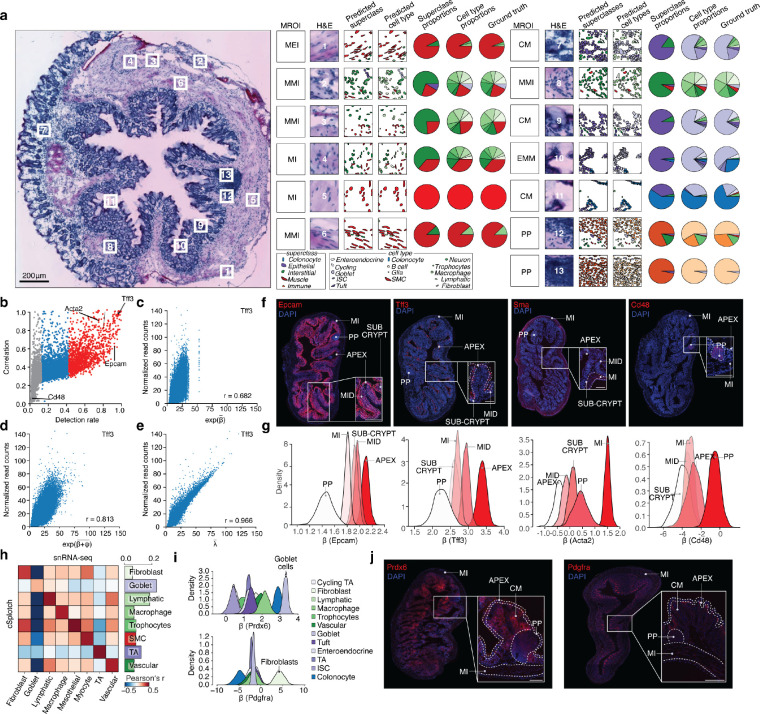
Fig. 2. Deconvolutional modeling using histological and expression features.
(a) Agreement of morphology-informed deconvolution with manual cell type annotation. Thirteen H&E patches from an example ST array (left; numbered boxes; scale bar: 200μm) with their (from left) MROI annotation, H&E image patch, semantic segmentation of morphological superclasses (color code; bottom left) and snRNA-seq cell types (color code; bottom right), and relative proportions of predicted superclasses (pie charts), predicted cell types, and manually labeled cell types (“ground truth”). (b-e) cSplotch validation. (b) Pearson correlation coefficients (y axis) between the expression rate estimated by cSplotch () and TPM normalized values in ST for the same spots scattered against the detection rate in ST (percentage of spots with non-zero measurements, x axis) for each of 12,796 genes (dots). Red/grey: top 10% / bottom 50% in detection rate. (c-e) Variance in Tff3 gene expression (y axis, normalized read counts) across spots (n=66,481, dots) explained by region alone (mean , x axis, c); region and location (mean (, x axis, d), or all components (mean , x axis, e) (all x axis values are. Lower right: Pearson’s . (f-g) IF validation of spatial gene expression trends predicted by cSplotch. (f,g) Immunofluorescence (IF) validation. (f) IF of four gene products (Epcam, Tff3, Sma, and Cd48; also highlighted in (b)) in proximal colon sections. Insets: zoom-in of a single colon crypt. Dotted lines: boundaries between MROIs: crypt apex (APEX), crypt mid (MID), sub-crypt (SUB-CRYPT), Peyer’s patch (PP), and muscularis interna (MI) (Epcam, Tff3, Sma scale bars: 200μm; Cd48 scale bar 100μm). (g) Probability density (y axis) for posteriors over regional rate terms () inferred by the cSplotch model for the genes in (f) in each MROI (color code). (h-j) Validation of the cellular expression profiles predicted by cSplotch. (h) Pearson correlation coefficient (color bar) between mean snRNA-seq profiles (columns) and mean cSplotch (rows) over the union of the top 50 cell type marker genes by snRNA-seq (Methods) for each of the top 8 cell types by mean cell fraction (columns, rows) in the sub-crypt for adult mice. Right: Pearson correlation for matching cell types. (i) Posteriors over cellular rate terms () inferred by cSplotch in CM in each abundant cell type (color code) for a goblet cell (Prdx6, top) and fibroblast (Pdgfra, bottom) marker in the CM region. (j) IF images of proximal colon sections for the genes (Prdx6 and Pdgfra) in (i). Insets as in (f). Scale bar: 200μm.

