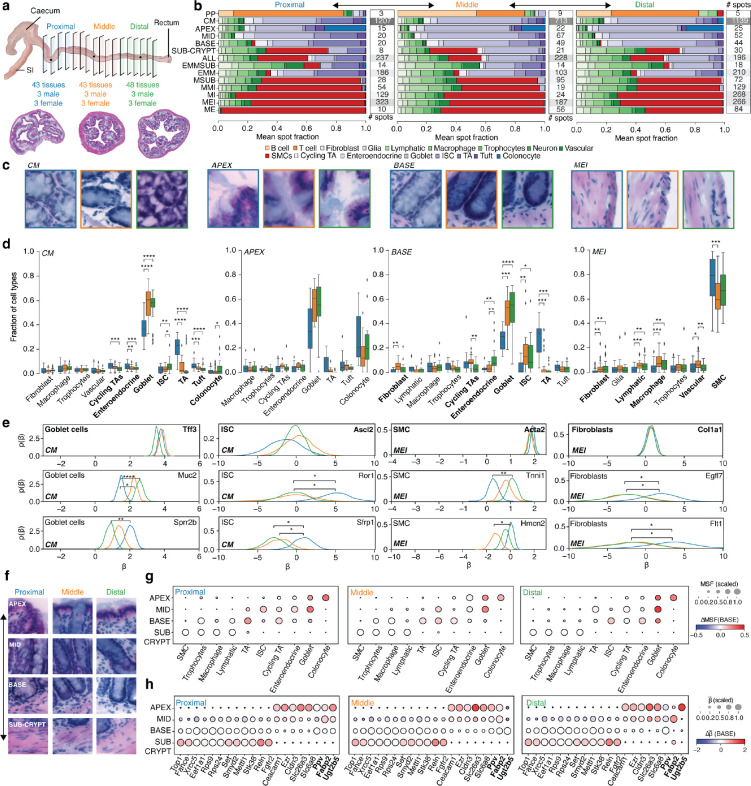
Fig. 3. Regional differences in cell composition and function in the adult colon.
(a) The atlas spans structural variation in the mouse colon along the proximal-distal axis. Illustrative H&E images of sections from proximal (left, blue), middle (mid, orange) and distal (right, green) regions. (b) Variation in cellular composition of MROIs across the proximal distal axis. Proportion of cells of each type (x axis, stacked bars; color code) in each MROI (y axis) in the proximal (left), middle (mid) and distal (right) regions of adult (12w) colon. # spots (right): Number of spots per MROI (color scale) in each colon region. (c, d) Variation in cell type composition of the same MROI type along the proximal-distal axis. (c) Representative H&E image patches from selected ST spots in four MROIs (left to right) from proximal (left, blue), middle (mid, orange) and distal (right, green) regions. (d) Fraction of cells (y axis) of each cell type (x axis) in the proximal (blue), middle (orange), and distal (green) regions in each of the MROI type in (c). Center black line, median; color-coded box, interquartile range; error bars, 1.5x interquartile range; *: 0.01 < FDR <= 0.05; **: 10−3 < FDR <= 0.01; ***: 10−4 < FDR <= 10−3; ****: FDR <= 10−4 (Welch’s t-test). Only cell types observed at a rate of 2% or greater across all spots in an MROI are shown. (e) Cell specific expression patterns vary across colon regions. Estimated posterior distributions of expression rate () for different genes in each colonic region (color) in goblet cells and ISCs in CM (two left columns) or SMCs and fibroblasts in MEI (two right columns). Bold: Canonical markers. Brackets: significant differential expression (*: Bayes factor (BF)>2; **: BF>10; ***: BF>30; ****: BF>100). (f-h) Variation in structure, cell composition and gene expression along locations. (f) Selected H&E image patches from ST across four MROIs (rows) from three colon regions (columns). (g) Scaled (dot size) and absolute (dot color) change in mean spot fraction (MSF, dot color) of each cell type (columns) in each MROI (rows) relate to BASE from three colon regions (panels). (h) Scaled (dot size) and absolute (dot color) change in mean log expression () of each gene (columns) in each MROI (rows) relative to BASE from three colon regions (panels). Bolded genes: expression gradients.

