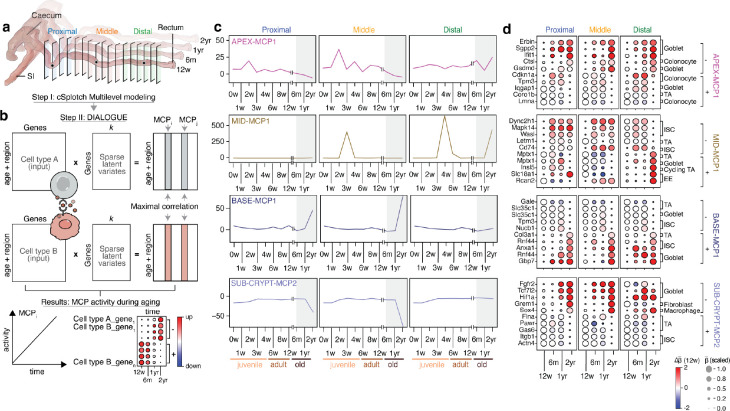
Fig. 4. Spatiotemporal changes in cell composition and function during colon aging.
(a,b) Analysis approach. cSplotch is used to characterize variability in cell-type specific gene expression across age and region (a), followed by MCP analysis with DIALOGUE54 (b) on inferred profiles for abundant cell types (e.g., cell types A and B) in each MROI across ages and regions. MCPs are returned as sets of genes with high correlation between two or more cell types across conditions (with positively (+, up) and negatively (−, down) contributing genes from each cell type (Methods). (c,d) Aging-associated MCPs. (c) Activity score (y axis) of selected MCPs (panels) from different MROIs (top left label) in each time point (x axis) and region (labels on top). Gray area: aging window. (d) Scaled (dot size) and absolute (dot color) change in log expression () relative to 12 weeks of each gene (rows) in each time point (columns) for selected up (+) and down (−) regulated genes from the MCPs in (c), sorted by their associated cell type (label on right).

