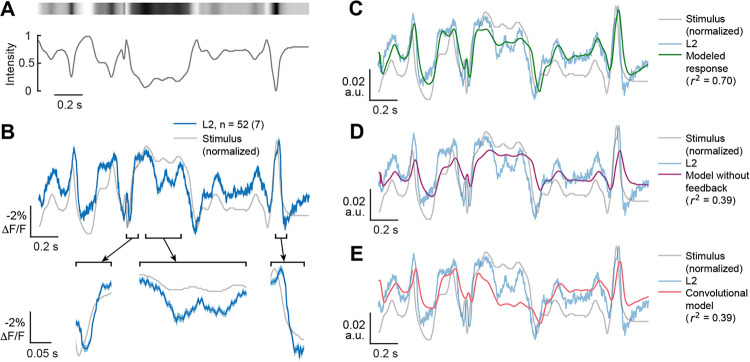
Figure 6. Both measured and modeled responses sharpen responses to naturalistic stimuli.
(A). The time varying changes in intensity of a full-field naturalistic stimulus (bottom) and a visual representation of the stimulus intensity (top).
(B) The measured response of L2 (blue, top) to this naturalistic stimulus, overlaid on an inverted stimulus trace (gray). Selected segments are depicted below as expanded insets (bottom) to better visualize response dynamics. The solid line is the mean response and the shading is ± 1 SEM. n = number of cells (number of flies).
(C) Full feedback model of L2 responses to the naturalistic stimulus using the same parameters as for the impulse responses, overlaid on the inverted stimulus (gray) and the measured response (light blue).
(D) As in (C), but using the model without feedback (magenta).
(E) As in (C), but with a convolutional model using the impulse response as a linear filter (red).

