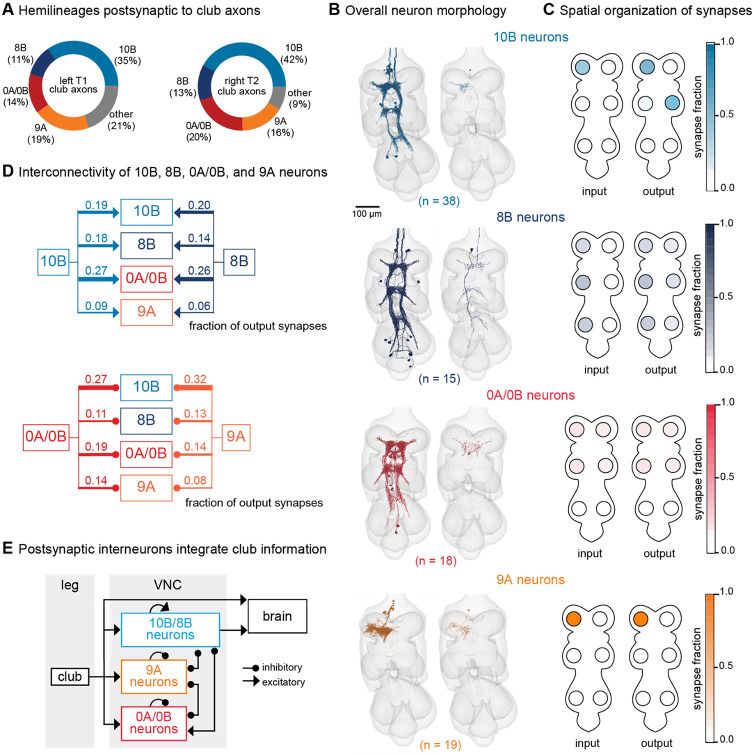
Figure 5. VNC neurons integrate vibration signals from club neurons across multiple legs.
(A) Fraction of total output synapses from club neurons onto downstream interneurons separated by hemilineage class. 10B (light blue, n = 38), 8B (dark blue, n = 15), 0A/0B (red, n = 18). 9A (orange, n = 19) (B) Reconstructed interneurons downstream of left T1 club neurons from the FANC dataset. Left image shows all reconstructed neurons from each hemilineage that are downstream of T1L club neurons. Right image shows a single example neuron from that hemilineage. (C) Heatmap depicting the spatial locations of input (left) and output (right) synapses for 10B, 8B, 0A/0B, and 9A interneurons that are downstream of T1L club neurons. (D) Circuit diagram depicting recurrent connections between 10B, 8B, 0A/0B, and 9A interneurons. Each line indicates an excitatory or inhibitory connection and is labeled with the fraction of total output synapses each interneuron class makes with another interneuron class. (E) Schematic of the multi-layered connectivity downstream of club axons.

