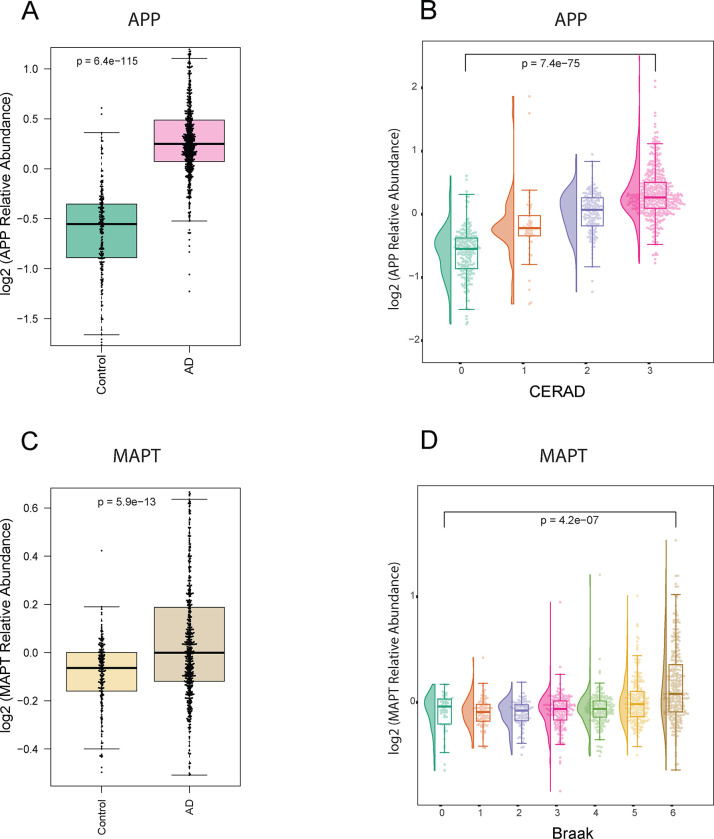
Fig 6. Correlation between proteomic Tau and APP measurements with Braak and CERAD pathological scoring.
A. Box plots depicting the relative abundance of APP across AD (pink) and control (green) in DLPFC tissue samples (adjusted ANOVA p-value < 0.05). B. Raincloud plots depict group differences in the relative abundance of Amyloid Precursor Protein (APP) (Y-axis) across distinct CERAD stages (X-axis) in DLPFC tissues. The analysis revealed a stepwise increase in the median APP levels with ascending CERAD classifications, indicating a progressive trend in APP abundance corresponding to different CERAD groups (score 1: green, score 2: orange, score 3: purple, score 4: pink). C. Box plots depicting the relative abundance of MAPT across AD (brown) and control (yellow) in DLPFC tissue samples (adjusted ANOVA p-value < 0.05). D. Raincloud plots illustrate the group differences in the relative abundance of Microtubule-associated protein tau (MAPT) (Y-axis) across distinct Braak stages (X-axis) in DLPFC tissues. The Braak stages range from 0 to 6, with corresponding colors representing different stages (0: dark green, 1: orange, 2: purple, 3: pink, 4: light green, 5: yellow, 6: brown). Notably, the analysis highlights elevated MAPT levels at Braak stages 5 and 6, aligning with the expected increase in tau tangles in later stages of Braak in the frontal cortex.

