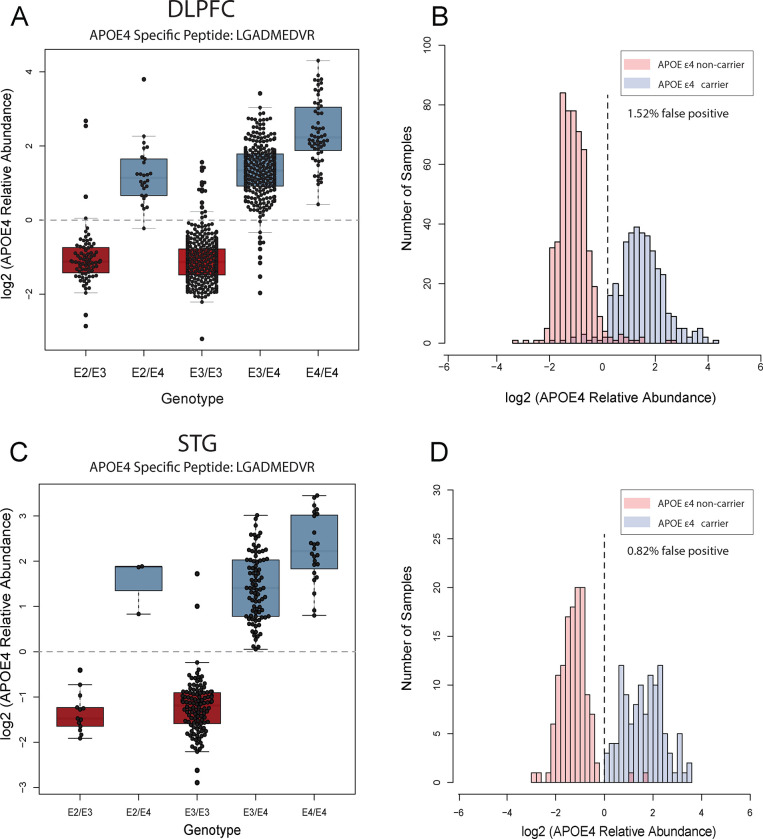
Fig 7. The association between APOE4 genotype and prototype across DLPFC and STG samples.
A. The boxplots of log2 normal abundance of APOE4 protein measured by TMT-MS across each APOE genotype reveal a high APOE4 abundance among APOE ε4 carriers among 920 unique DLPFC tissue samples. B. Histogram of APOE4 log2 normal abundance among DLPFC samples (Y-axis) across ε4 allele presence (red) and non-presence (blue) (X-axis). C. The boxplots of log2 normal abundance of APOE4 protein measured by TMT-MS across 244 STG unique tissue samples reveal a high APOE4 abundance among APOE ε4 carriers. D. Histogram of APOE4 log2 normal abundance among STG samples (Y-axis) across ε4 allele presence (red) and non-presence (blue) (X-axis). high levels of APOE4 abundance were observed in cases with the ε4 allele combination in both cortices, a few discrepancies between APOE4 genotyping and prototyping (purple) were depicted. These inconsistencies may be attributed to various factors, including mis-genotyping or potential technical challenges in mass spectrometry measurements, such as isotope impurity and low signal-to-noise ratio in specific samples.

