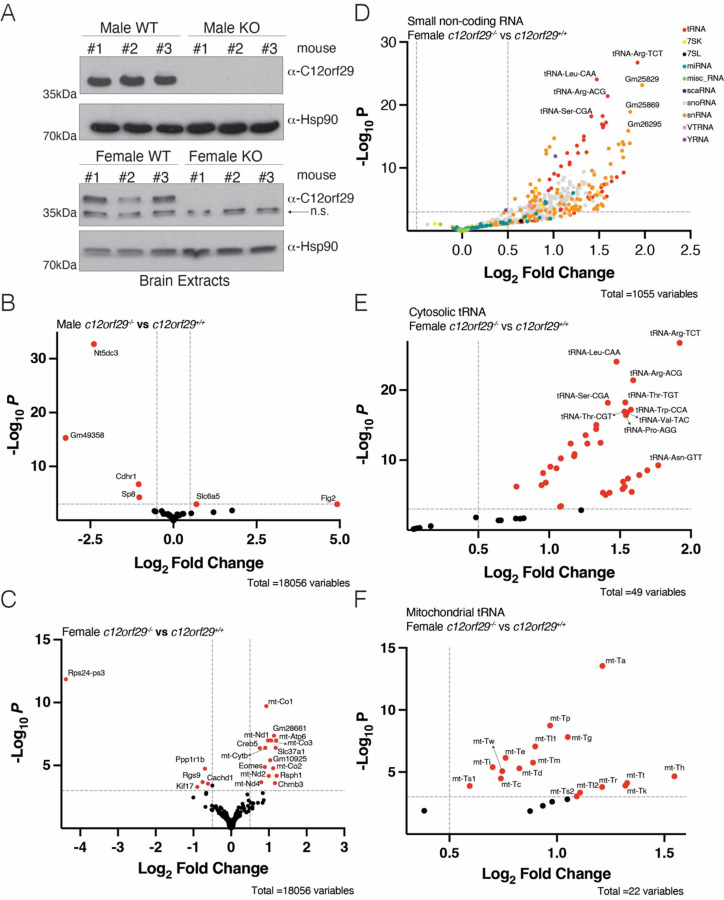
Figure 3. Female c12orf29 KO mice have alterations in small non-coding transcripts.
(A) Protein immunoblots of mouse brain lysates depicting C12orf29 levels in C12orf29+/+ and C12orf29−/− mice. Hsp90 is shown as a loading control. n.s. stands for non-specific. (B-C) Volcano plot from TGIRT-seq analysis comparing protein-coding genes or pseudogenes from male (B) or female (C) C12orf29−/− and C12orf29+/+ mice. Genes significantly changed are in red. The log2 fold change cutoff is 0.5 and the p-value cutoff is 0.001. (D) Volcano plot from TGIRT-seq analysis comparing small non-coding transcripts from female C12orf29−/− and C12orf29+/+ mice. The log2 fold change cutoff is 0.5 and the p-value cutoff is 0.001. (E-F) Volcano plot from TGIRT-seq analysis comparing cytosolic tRNAs (E) or mitochondrial tRNAs (F) from female C12orf29−/− and C12orf29+/+ mice. tRNAs significantly changed are in red. The log2 fold change cutoff is 0.5 and the p-value cutoff is 0.001.

