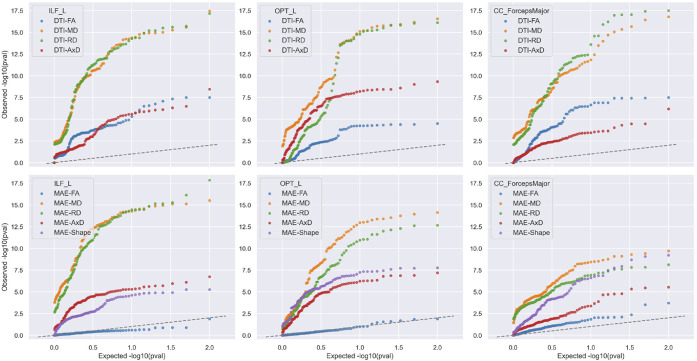
FIGURE 7. Ranking Diffusion Metrics for their Sensitivity to Dementia.
Here we show a QQ plot of after FDR correction for dementia vs. CN group comparison in the ADNI cohort, for 4 DTI- and 5 MINT-derived diffusion measures in ILF_L, OPT_L and CC_ForcepsMajor. Microstructural metrics that are associated most strongly with dementia are typically MD and radial diffusivity (RD), shown in orange and green colors. The dashed line in these plots shows the pattern of values that would be expected for null measures, i.e. brain metric that shows no association with Alzheimers disease. For some tracts, the MAE-FA is not much better than a null measure (i.e., shows no detectable association with dementia).

