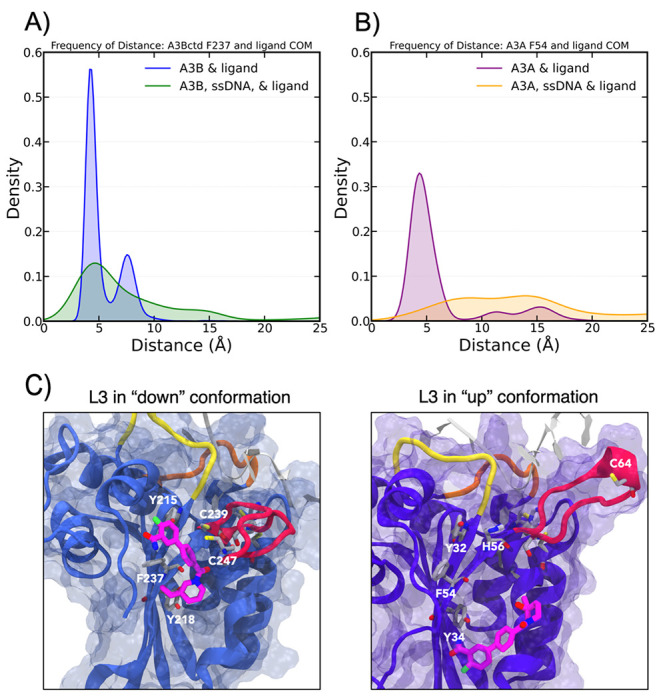
Figure 6.

A) Distance between the ligand center of mass (COM) and F237 for all 3 μs of simulations of A3Bctd of each system. B) Distance between the ligand center of mass (COM) and F54 for all 3 μs of simulations of A3A of each system. C) A3A (left) and A3Bctd (right) with 10 in the allosteric pocket, with the up and down conformation of L3 (in red) displayed. L1 is shown in yellow, and L7 is shown in orange. ssDNA is shown in gray, and selected residues in the allosteric site are highlighted.
