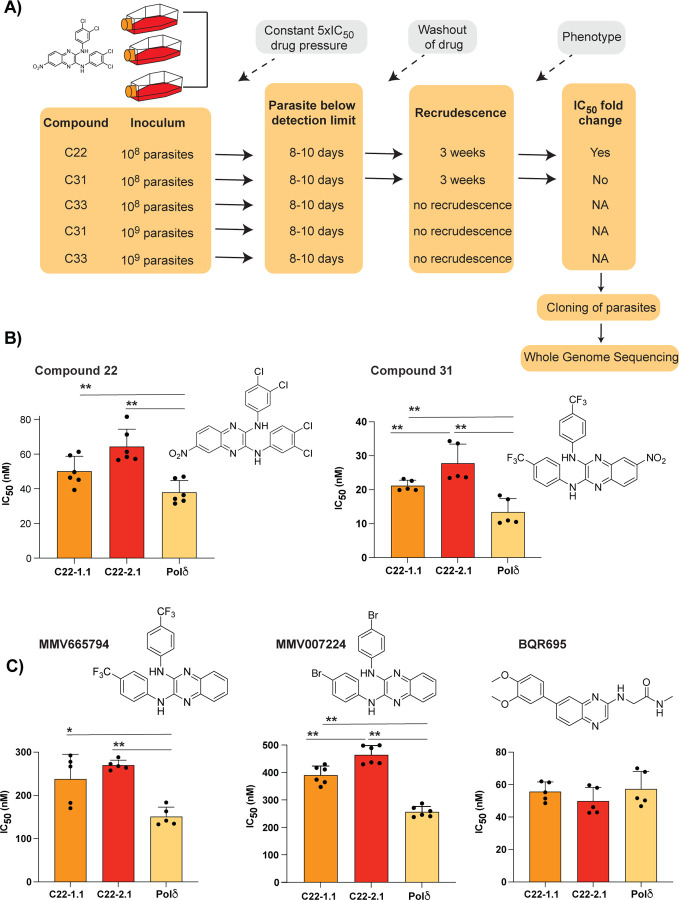
Figure 2: Evolution of resistance to quinoxaline-containing compounds.
A) Selection scheme showing attempts to generate resistance using the Dd2-Pol𝛿 mutator line. Indicated are the compound, parasite inoculum, selection period during which parasites were exposed to 5xIC50, recrudescence status of cultures, and shift in IC50 of the bulk culture. B) Clones from two independent flasks (1.1 and 2.1) from the compound 22 selection were evaluated against compounds 22 and 31. The parental line, Dd2-Pol𝛿 (Pol𝛿) was used as the control. C) Clones (1.1 and 2.1) from the compound 22 selection were evaluated against other quinoxaline-containing compounds, MMV665794, MMV007224 and BQR695. Each dot represents a biological replicate (n=4–6) with mean±SD shown as bar chart, and statistical significance determined by Mann-Whitney U test (*p<0.05, **p<0.01).

