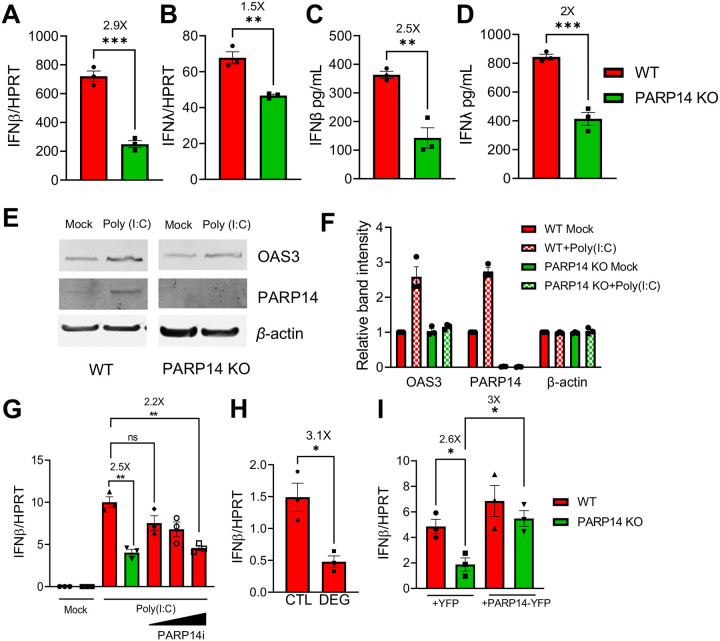
Fig. 1. PARP14 promotes IFN production following poly(I:C) treatment in human A549 cells.
A-B) WT (red bars) and PARP14 knock-out (KO) (green bars) A549 cells were transfected with 0.5ug/mL poly(I:C), RNA was isolated from cells at 18 hours post-tranfection (hpt) and IFNβ (A) and IFNλ (B) mRNA levels were quantified by qPCR using ΔCt method. C-D) WT and PARP14 KO cells were transfected with 0.5μg/mL poly(I:C). Supernatant was collected 18 hpt and IFNβ (C) and IFNλ (D) protein levels were quantified by ELISA. Data shown in A-D are from 1 experiment and are representative of 3 independent experiments with N=3 for each experiment. E) WT and PARP14 KO cells were either mock transfected or transfected with 0.5 μg/mL of poly(I:C). Cell lysates were collected at 18 hpt and OAS3 and PARP14 protein levels were determined by immunoblotting using β-actin as a loading control. F) Band intensities from E were quantified by densitometry, normalized to β-actin, and then relative levels as compared to mock transfected WT cells were determined. Data shown in E-F are from 1 experiment and are representative of 3 independent experiments with N=1 for each experiment. G) WT cells were either mock transfected or transfected with 0.5 μg/mL of poly(I:C) and were immediately either treated with DMSO (vehicle) or with increasing concentrations of PARP14i (0.01, 0.1, and 1 μM). At 18 hpt RNA was isolated from cells and IFNβ mRNA was quantified by qPCR using ΔCt method. H) WT A549 cells transfected with poly(I:C) were treated with 1 μM PARP14 Degron control (CTL) or PARP14 Degron (DEG) for 18 hours. RNA was isolated from cells at 18 hpt and IFNβ mRNA was quantified by qPCR using ΔCt method. I) WT and PARP14 KO cells were transfected with 0.5 μg of YFP or YFP-PARP14 plasmids. At 48 hpt cells were transfected with 0.5 μg/mL of poly(I:C) and 18 hours later RNA was isolated from cells and IFNβ mRNA was quantified by qPCR using ΔCt method. Data shown in G-I are from 1 experiment and are representative of 3 independent experiments with N=3 for each experiment.

