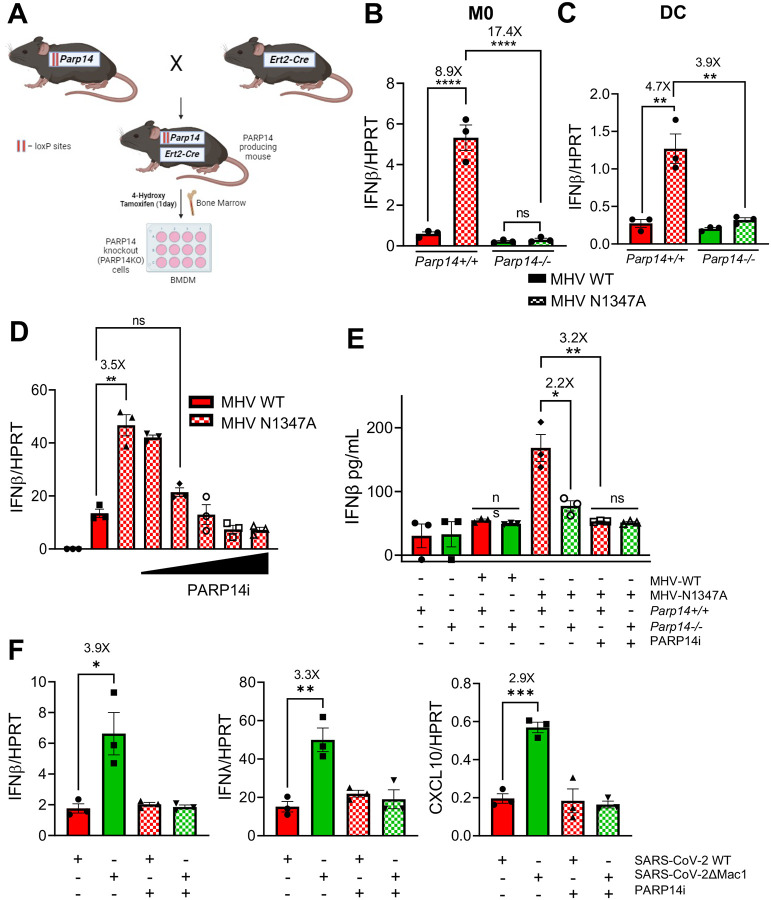
Fig. 2. PARP14 promotes IFN production following Mac1 mutant CoV infection.
A) Schematic diagram showing the generation of PARP14 KO mice for Bone-marrow cell isolation. Parp14 floxed mice were crossed with cre heterozygote mice and the resulting progeny were used to harvest bone marrow. Bone marrow cells were isolated and plated with 10ng/mL of mCSF or GM-CSF for 6 days to differentiate cells into M0 macrophages or dendritic cells (DCs), respectively. On day 6, these cells were treated with 1μg/mL of 4-hydroxy tamoxifen (4-OHT) for 24 hours to induce Cre expression leading to the removal of exon 2 of Parp14 (for details see Methods). B-C) Parp14+/+ (Cre−) (red bars) and Parp14−/− (Cre+) (green bars) M0 cells (B) or DCs (C) were infected with MHV WT (solid bars) and N1347A (checkered bars) at an MOI of 0.1. RNA was isolated from cells at 12 hpi and IFNβ mRNA was quantified by qPCR using ΔCt method. D) Parp14+/+ cells were infected with WT and N1347A at an MOI of 0.1 and then treated at 1 hpi with DMSO or increasing concentrations of PARP14 inhibitor (PARP14i) (3, 11, 33, 99 and 297nM). RNA was isolated from cells at 12 hpi and IFNβ mRNA levels were quantified using qPCR using ΔCt method. E) Parp14+/+ and Parp14−/− M0 macrophages were infected with WT and N1347A MHV at an MOI of 0.1 and then treated with DMSO or 100 nM PARP14i at 1 hpi. The cell supernatant was collected at 12 hpi and IFNβ protein was quantified by ELISA. F) A549-ACE2 cells were infected with WT and ΔMac1 SARS-COV-2 at an MOI of 0.1 and treated with DMSO or PARP14i. RNA was isolated from cells at 48 hpi and IFNβ, IFNλ and CXCL10 mRNA levels were quantified by qPCR using ΔCt method. Data shown in B-F are from 1 experiment and are representative of 3 independent experiments with N=3 for each experiment.

