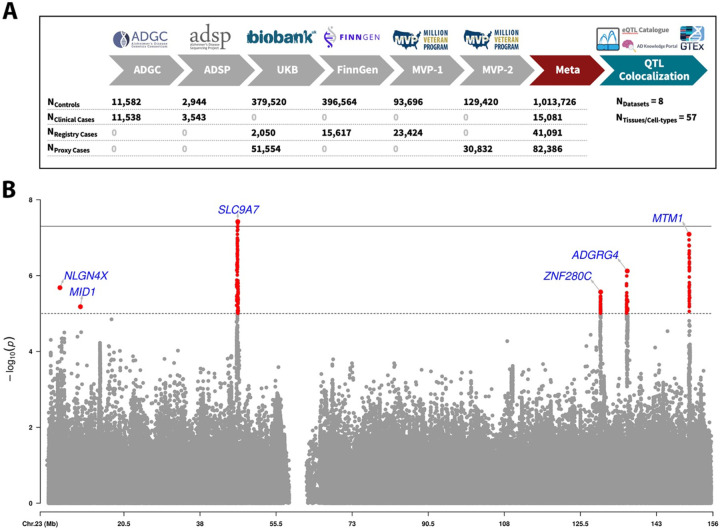
Figure 1. X chromosome-wide association study of Alzheimer’s disease.
A) Overview of study design and sample sizes. To increase specificity to AD (rather than ADD), the XWAS meta-analysis was intersected to variants with association results in ADGC (which used only clinically confirmed cases and controls). B) Manhattan plot for the XWAS meta-analysis. The dotted line indicates X-chromosome-wide significance (P-value<1e-5) and full line indicates genome-wide significance (P-value<5e-8). Lead variants for independent loci are annotated with their nearest protein-coding gene (Gencode v42).

