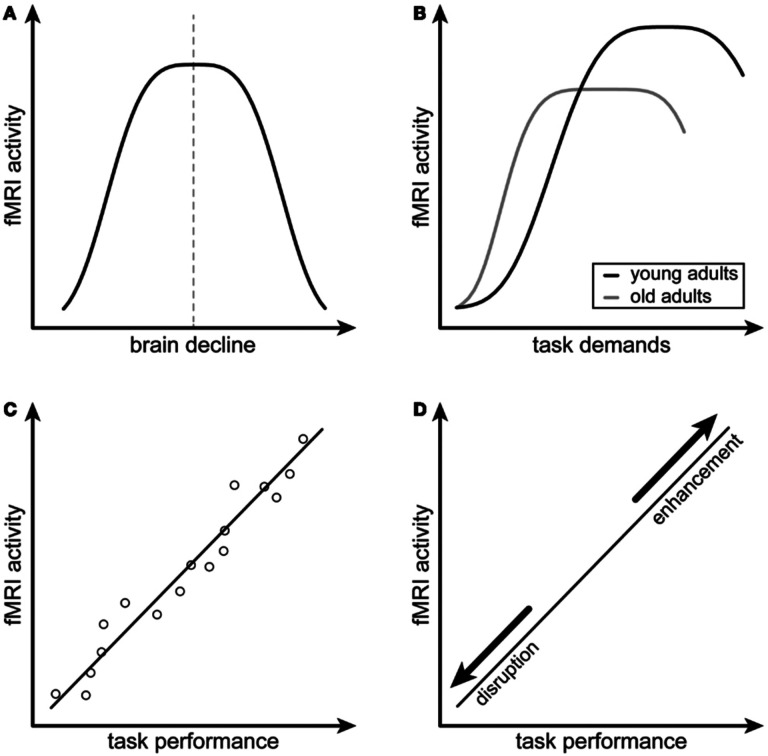
Figure 1. Conceptual Model for Compensatory Neural Hyperactivity by Dennis and Cabeza (2013).
Criterion A indicates that compensatory neural activity as measured by functional magnetic resonance imaging (fMRI), shows an inverted U-shaped relationship with brain decline. Criterion B indicates that compensatory neural activity decreases with increased task difficulty, especially in older individuals. Criterion C indicates that compensatory neural activity is positively associated with task performance. Criterion D indicates that the relationship between compensatory neural activity and task performance is disrupted or enhanced by modulating the hyperactive brain regions. Figure reprinted from Scheller, Minkova (16) under the terms of the Creative Commons Attribution License (CC BY).

