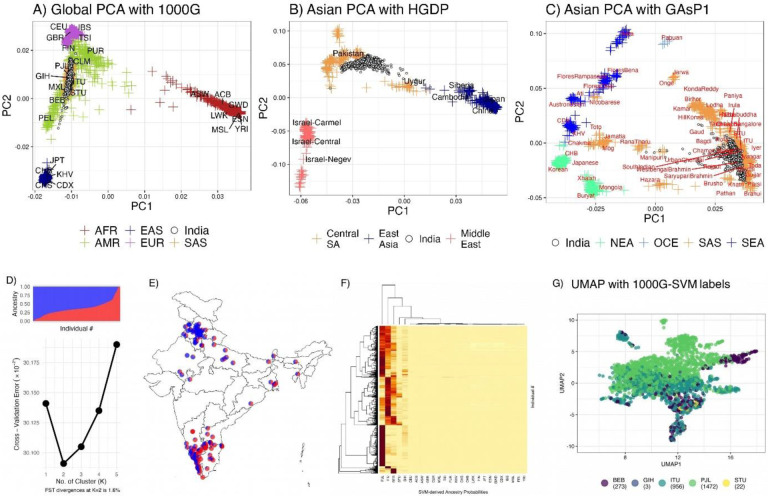
Figure 1:
Population structure and genetic diversity in Indian samples
Global PCA (1A) illustrates the placement of Indian samples between European and East Asian clusters, highlighting notable regional variability. Asian PCA with HGDP samples (1B) reveals distinct clustering of Indian samples, absent in HGDP, situated between Pakistani and Uyghur populations. Asian PCA with Genome Asia samples (1C) demonstrates significant overlap with urban South Asians, indicating urban genetic diversity. ADMIXTURE analysis (1D) reveals a two-cluster genetic structure with a 1.6% F_ST, reflecting modest diversity. Geographic mapping of a subset of samples (1E) presents a north-south ancestral gradient, correlated with latitude. SVM predictions (F) show clustering around key South Asian populations, while UMAP visualization (G) delineates distinct ancestral clusters corresponding to geographical regions, highlighting spatial genetic patterns in India

